We’re a few posts into our blog series comparing the performance between the Silk Platform and NetApp Cloud Volumes ONTAP for AWS (as published in a whitepaper on NetApp’s website) You can find my first two blog posts where we looked at some basic hero number tests with 4K Random Reads and a simple 8K Transactional/OLTP type workload.
In today’s lesson, we’re going to take a look at how Silk and NetApp compare when it comes to doing high throughput sequential reads, and then I’ll show you how Silk handles the same high throughput in a random fashion, but we won’t compare that to NetApp because they did not do a random read test for large block. I couldn’t say why, exactly. But we did! I know you are itching to go, so let’s do it.
How Silk and NetApp Differ
Refer back to my previous posts about how Silk and NetApp’s architectures differ or take a look at our whitepaper which goes into depth about our design. But briefly: The Silk cloud data platform is a modern, auto-scalable, symmetric active-active architecture that delivers extreme performance across any workload profile, leveraging cloud native IaaS components. Performance is our brand, and our system is built to deliver it for mission-critical workloads.
In today’s comparison, we’ll look at a 64KB block size Sequential Read (100% reads and 100% sequential access I/0) test. You typically see this type of workload generated by applications like streaming media services, such as Netflix. I don’t know about you, but after the past year, if my streaming service is buffering, it feels like the end of the world! So let’s make sure that you’re getting the fastest throughput! It’s also typical of more mundane things, like writing SQL transaction logs or pushing backups.
As always, we will compare the two smallest configurations—Silk 2 c.nodes to NetApp’s m5.2xlarge—and then we will compare the biggest configurations.
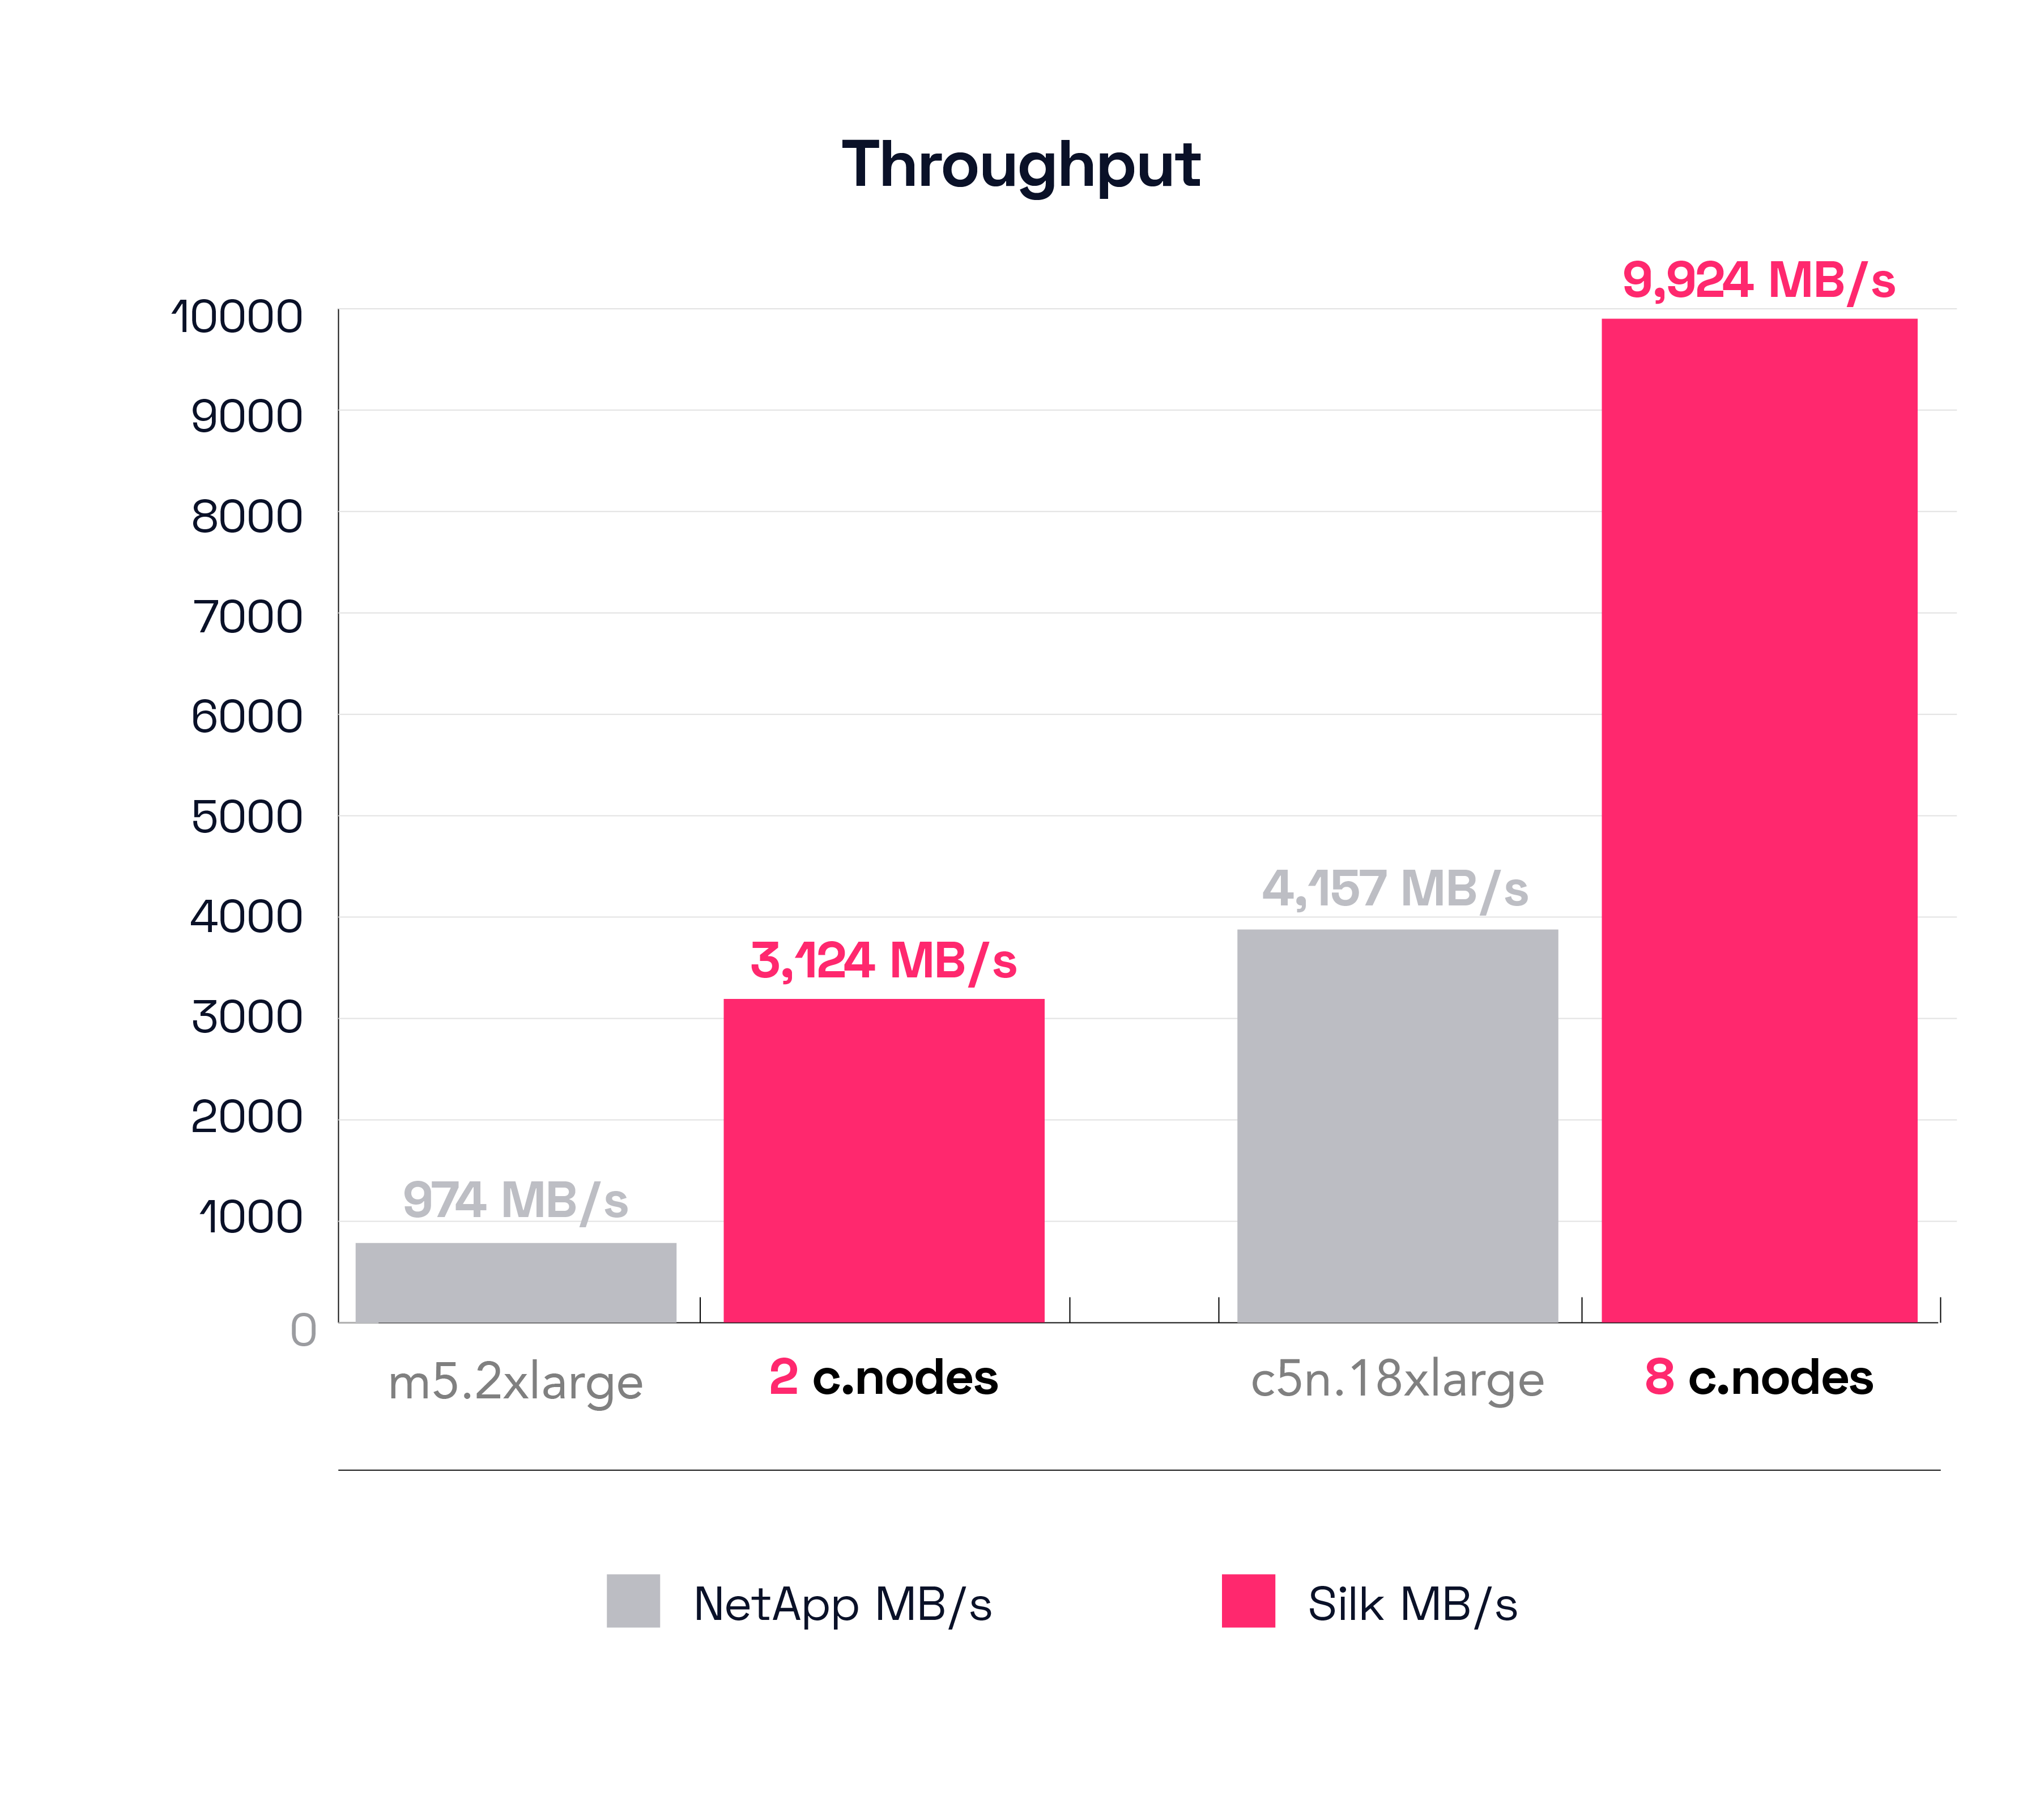
The Result – Sequential Read Throughput (64K block 100% Sequential Read – Single Node)
First off let’s examine the results for the small configs. The small Silk was able to push 3,124 MB/s of throughput (51,397 IOPS), and the NetApp m5.2xlarge could only move 974 MB/s (15,214 IOPS). Silk is moving over 3 times as much data (220% more, to be exact, well—it’s 220.739% exactly). Not bad!
In the second part of the graph we see the two largest configurations, Silk’s 8 c.node, which is able to drive 9,924 MB/s of throughput (alas, >this< close to 10 GB/s!) while NetApp’s c5n.18xlarge pushed 4,157 MB/s, less than half (58% less) of what the Silk system did.
Silk is able to drive greater throughput because it uses a broader aggregation of cloud IaaS network and compute resources in a true symmetric active-active fashion. When we say true fashion, we mean all of this throughput is from a single Silk Data Pod pool of storage that is being served in a fully parallelized symmetric fashion across all 8 nodes at once. It’s not multiple different pools of storage attached to different controllers where a total aggregated amount of different IO is then totted up and presented as it if was a single result.
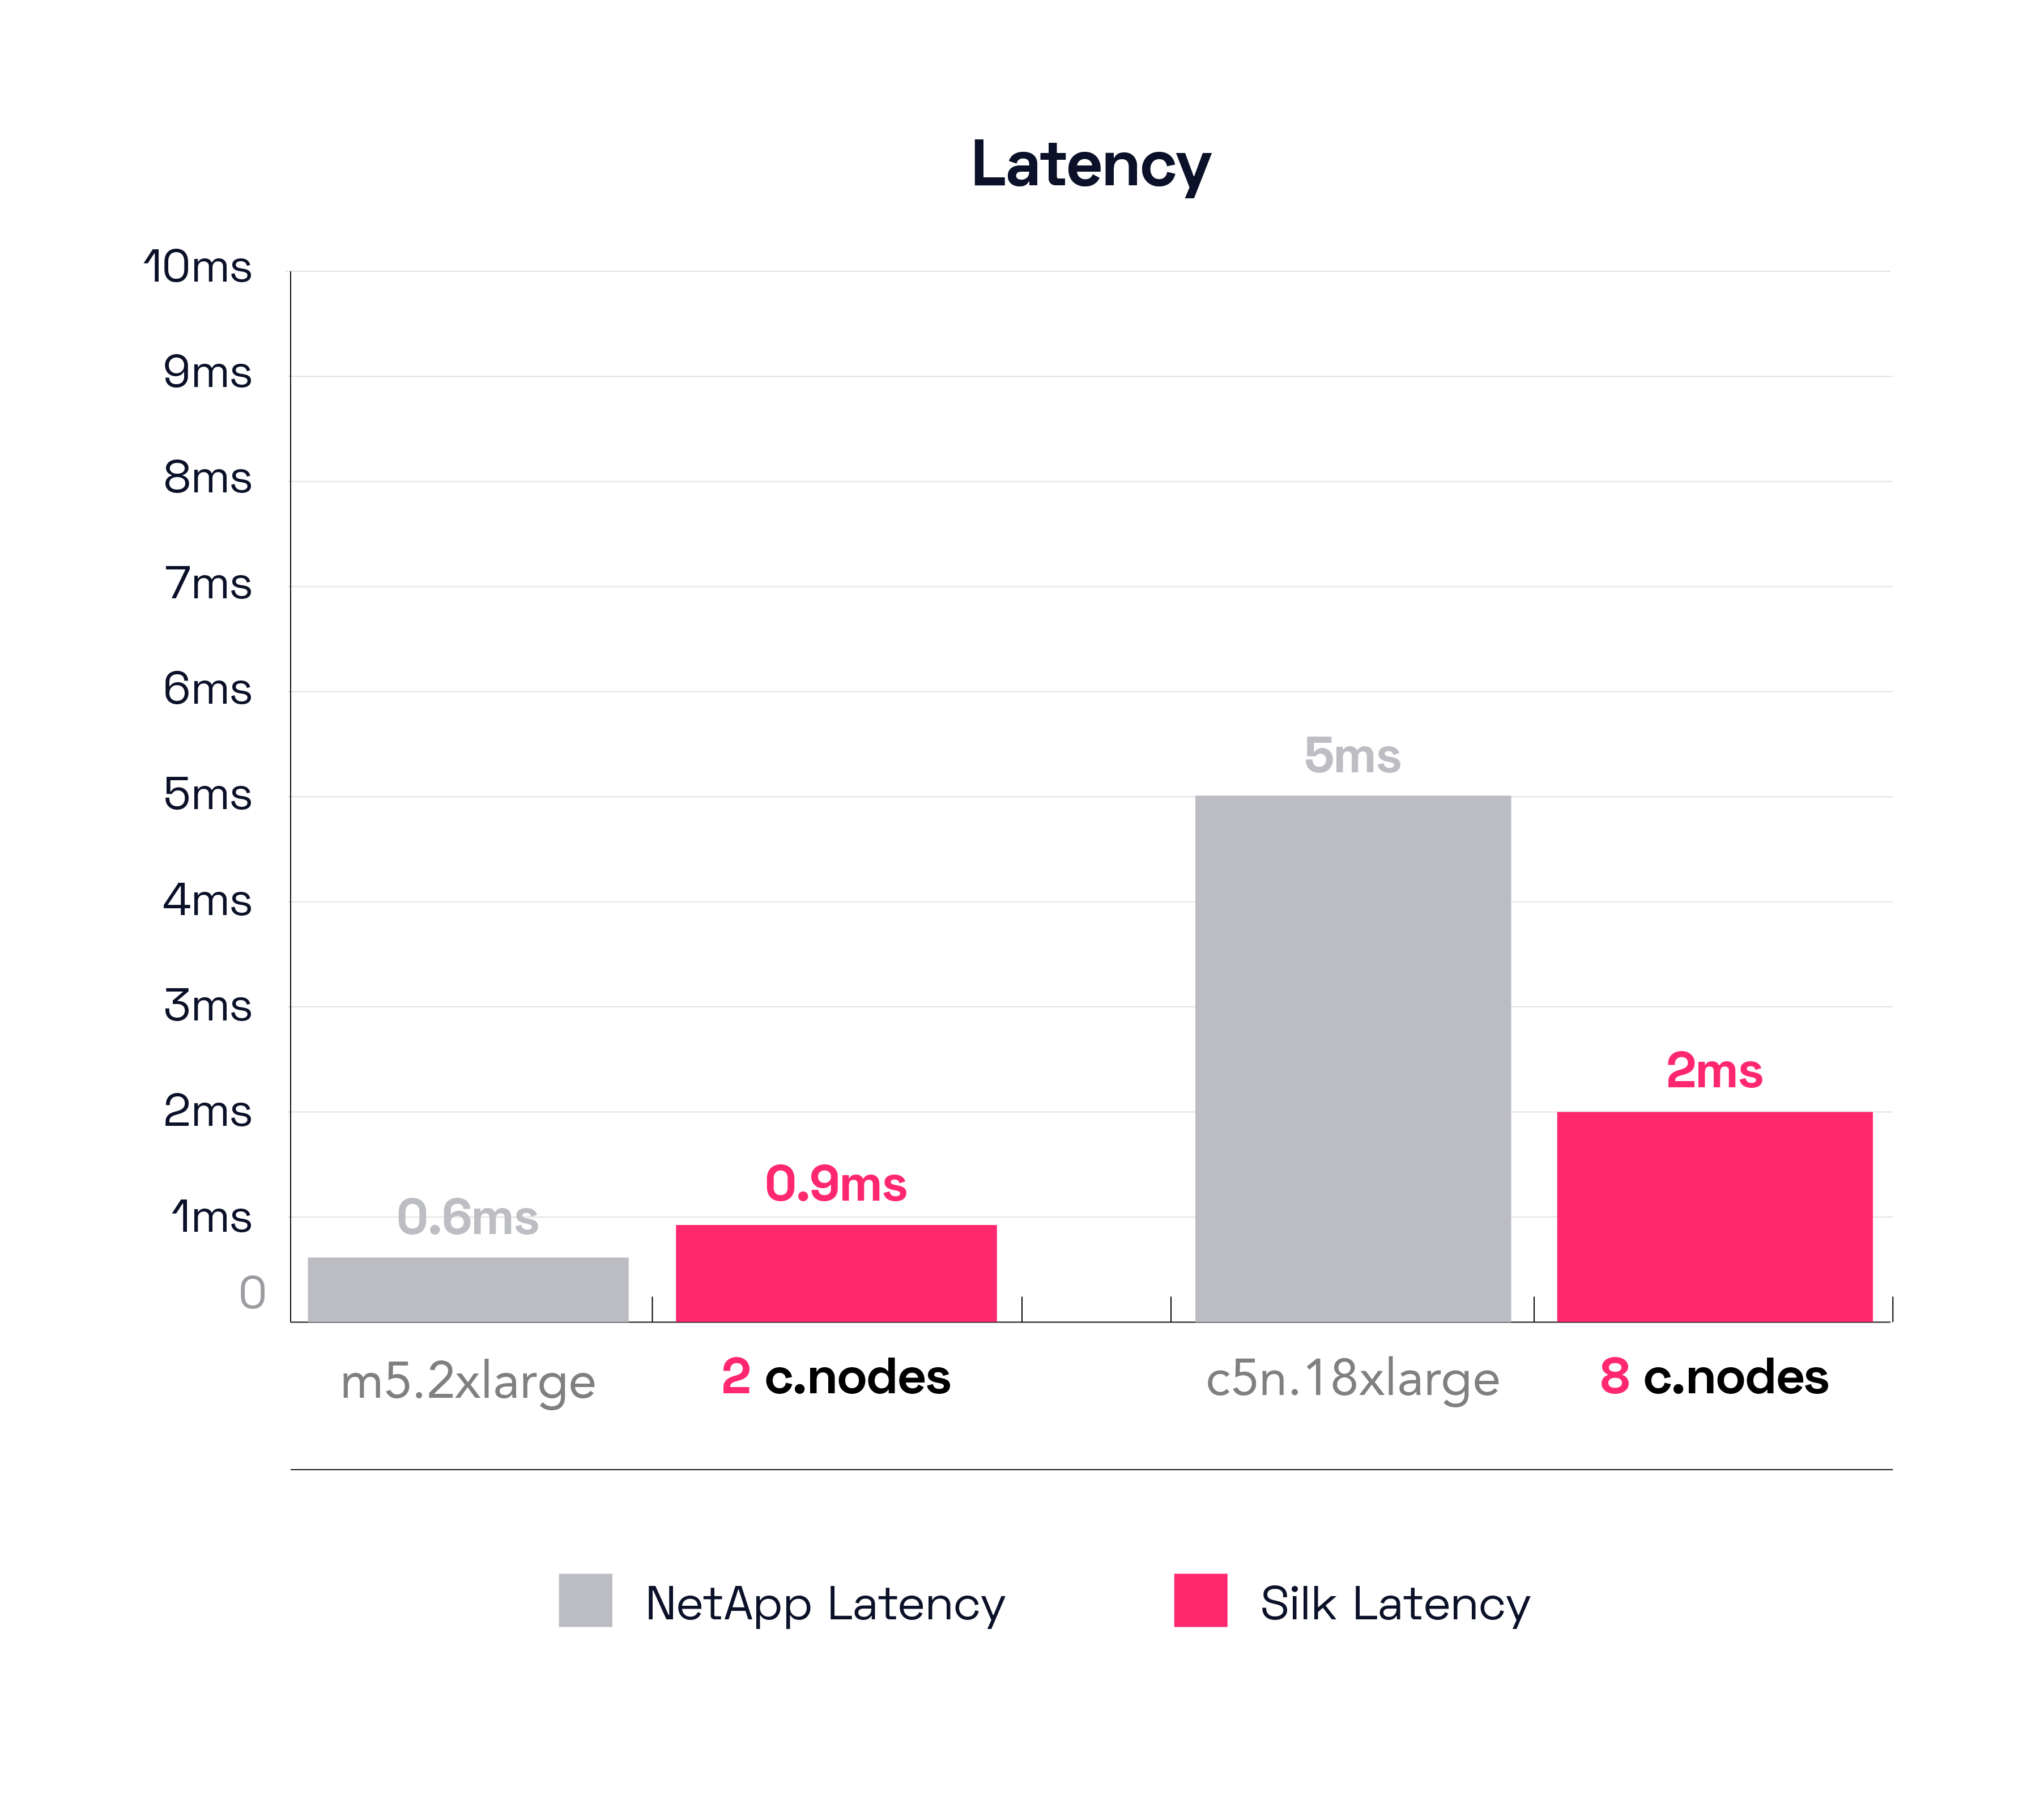
In the next chart we’ll check on IO latency. While latency isn’t as critical for these kinds of operations as it is for transactional workloads, it’s still quite important when you start combining workloads—either from a single complex database application or multiple applications, or perhaps from a multitude of hosts doing all sorts of different things—you don’t want any particular workload profile taking up all the cycles and starving out the other stuff (the classic noisy neighbor problem). This test doesn’t look at that (only a single workload being tested here today), but no worries, I will soon,in another post, show you real world heavy duty mixed workloads of VSI+VDI, Oracle and SQL processing.
With regards to latency–briefly, both systems did well on latency here. The NetApp m5.2xlarge was executing at 600 microseconds and the Silk was running 900 microseconds, sub millisecond latency for both systems. The Silk is pushing over three times more data however (3.2x more or a 220% increase), so there is that. OK, now let’s look at the large systems latency to make sure things are still copacetic, the large Silk is moving almost 10GB/s of data at 2ms latency, while the NetApp c5n.18xlarge is taking 5ms, which is 2.5 times as long. The Silk is pushing ~5.8GB/s MORE data, while doing it at only 40% of the latency of the NetApp. *chef’s kiss*
Alright, we’re off to a very nice start! As per our norm, we will now look at a comparison with NetApp’s “High Availability” setup which should yield them a great result, since this is a read only workload (made to order for NetApp’s read cache based architecture) and it doubles the entire data and controller footprint via synchronous replication–which you can review in detail in the NetApp white paper.
The (HA) Test Result – Sequential Reads Throughput (64K 100% Sequential Read – Multi Node)
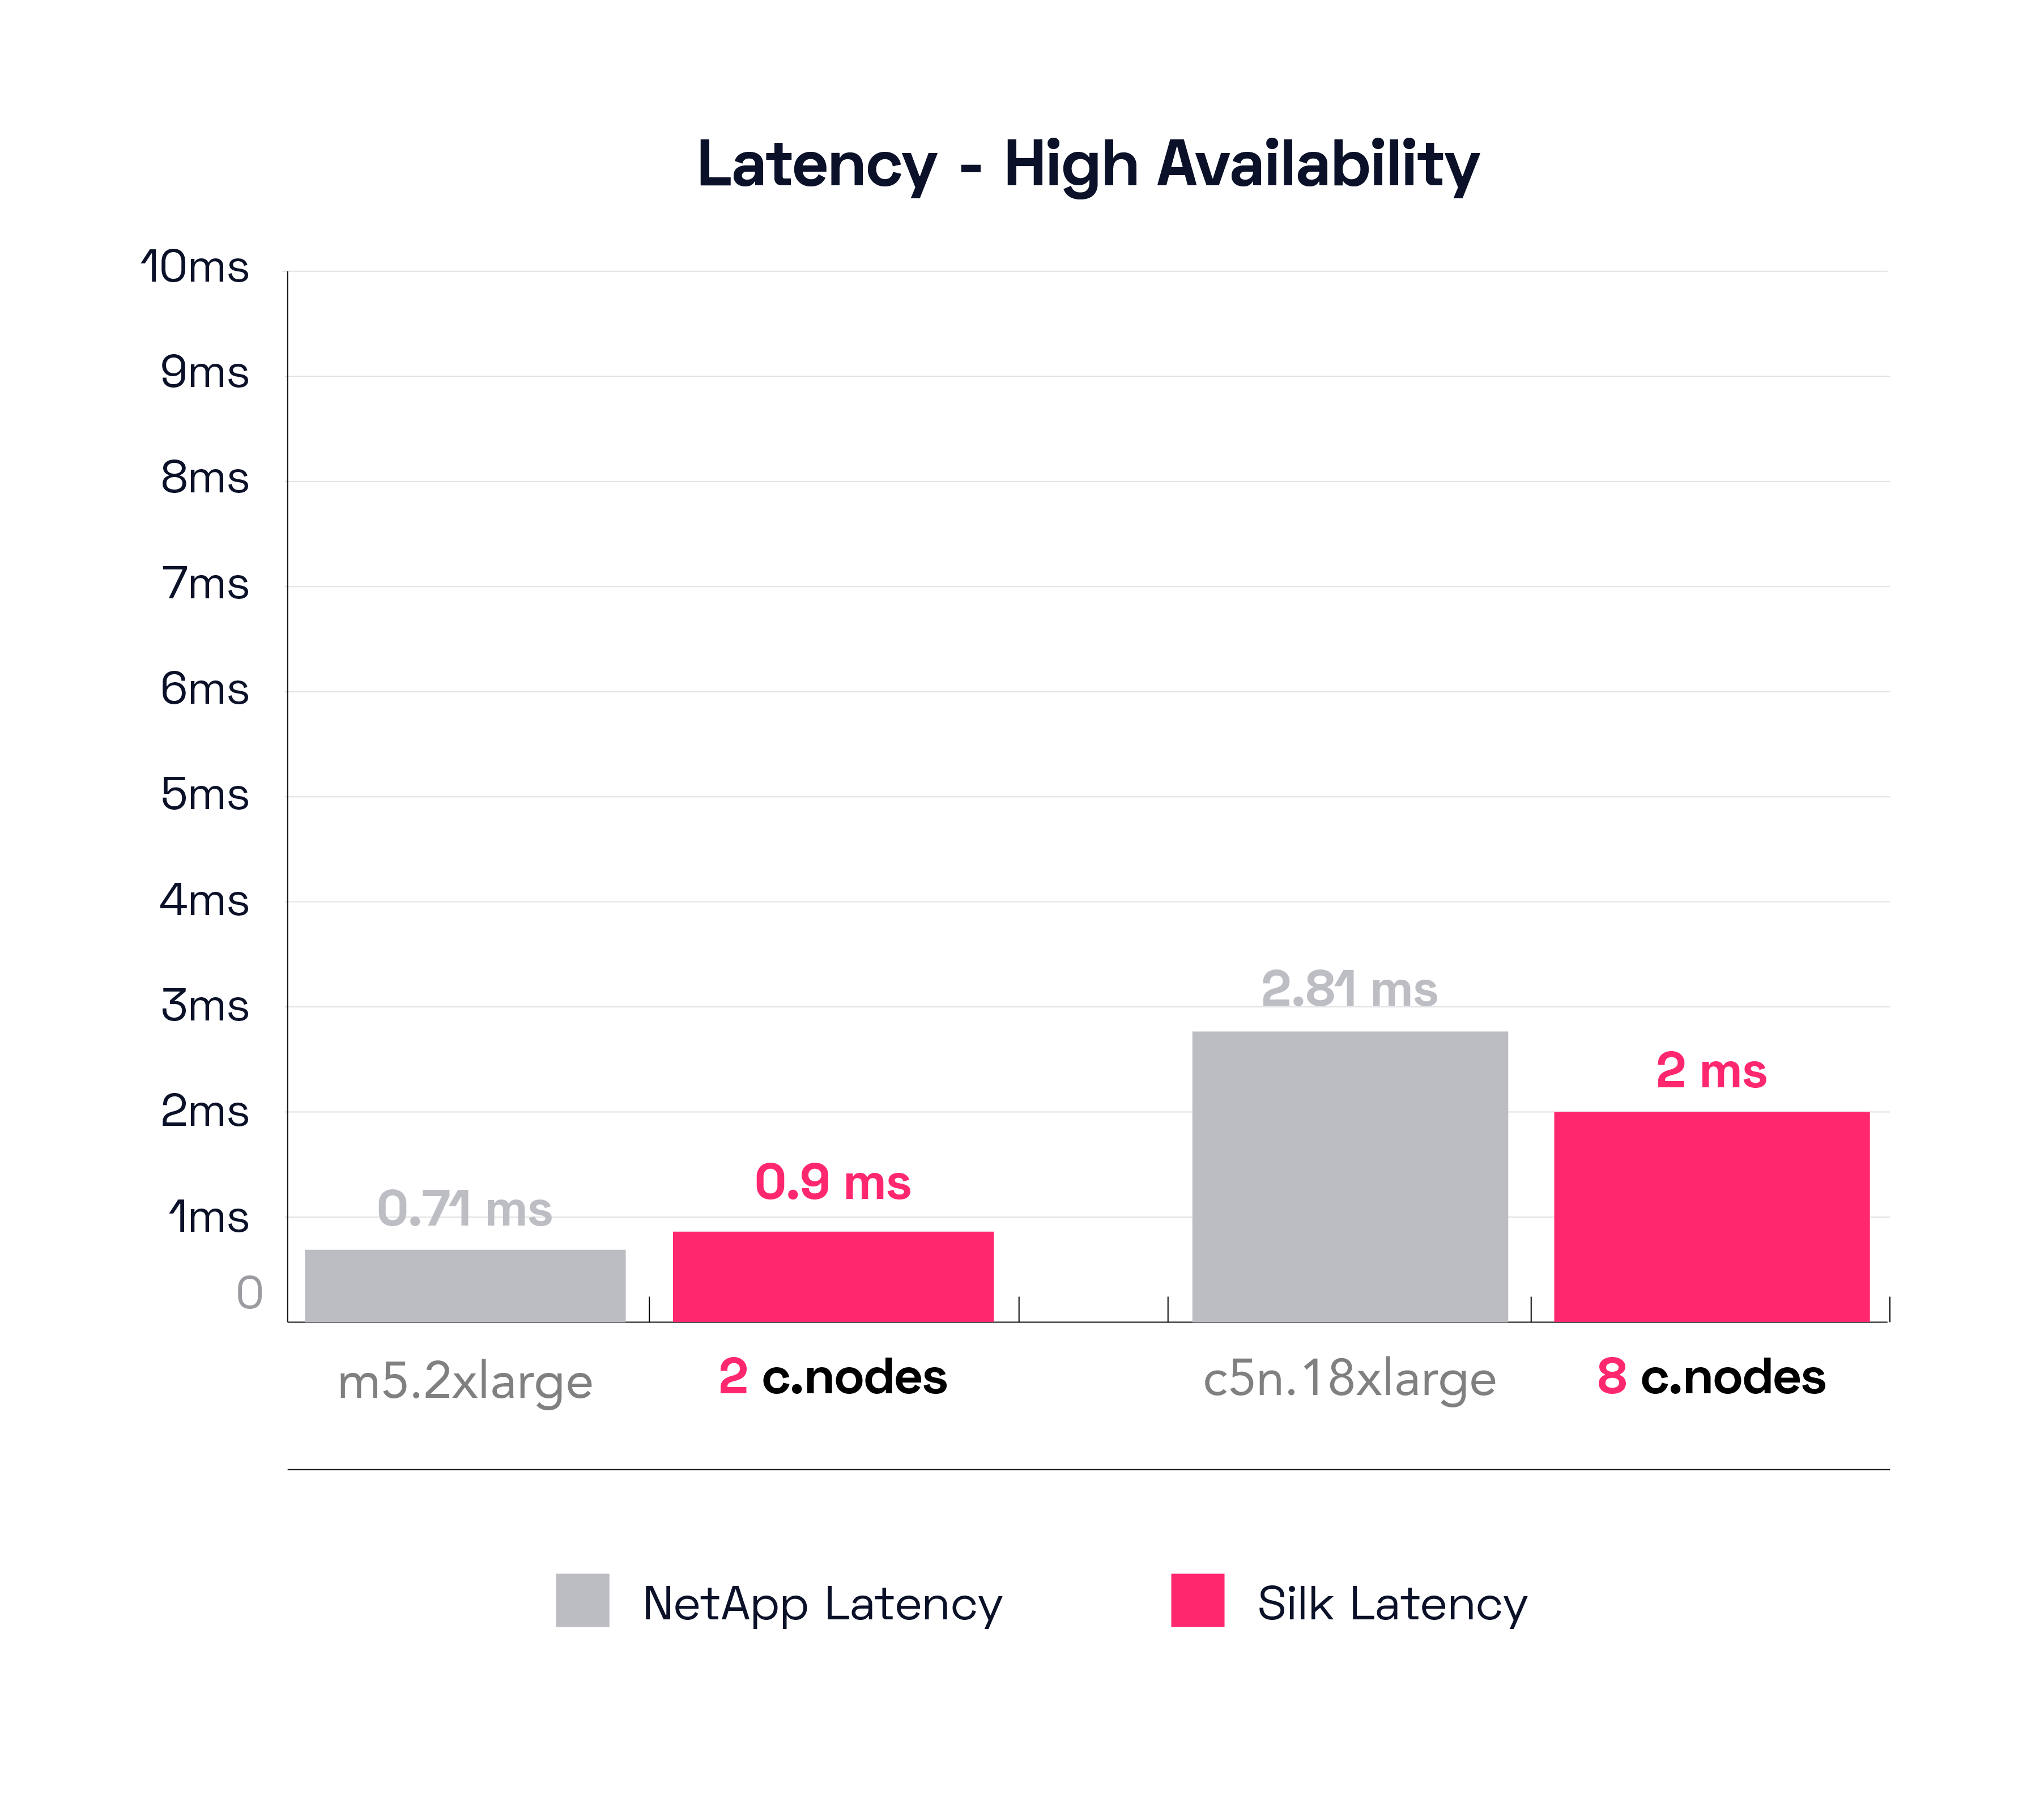
Let’s look first at NetApp’s smallest config. In this case it’s different from the previous test, now the config with the best result is the m5d.8xlarge. The m5d.8xlarge can move 2,449 MB/s of throughput at a latency of 710 microseconds. As a reminder, the small Silk was able to push 3,124 MB/s at 900 microseconds, which is still 28% more throughput than the NetApp.
Next, we’ll check NetApp’s best result, which again, is a different config from the first test for some reason, this time it is the c5n.9xlarge. That config was able to push 8,973 MB/s at 2.81ms latency, which is still about 10% less than what the large Silk system did, and the NetApp is taking 40% longer latency to do it.
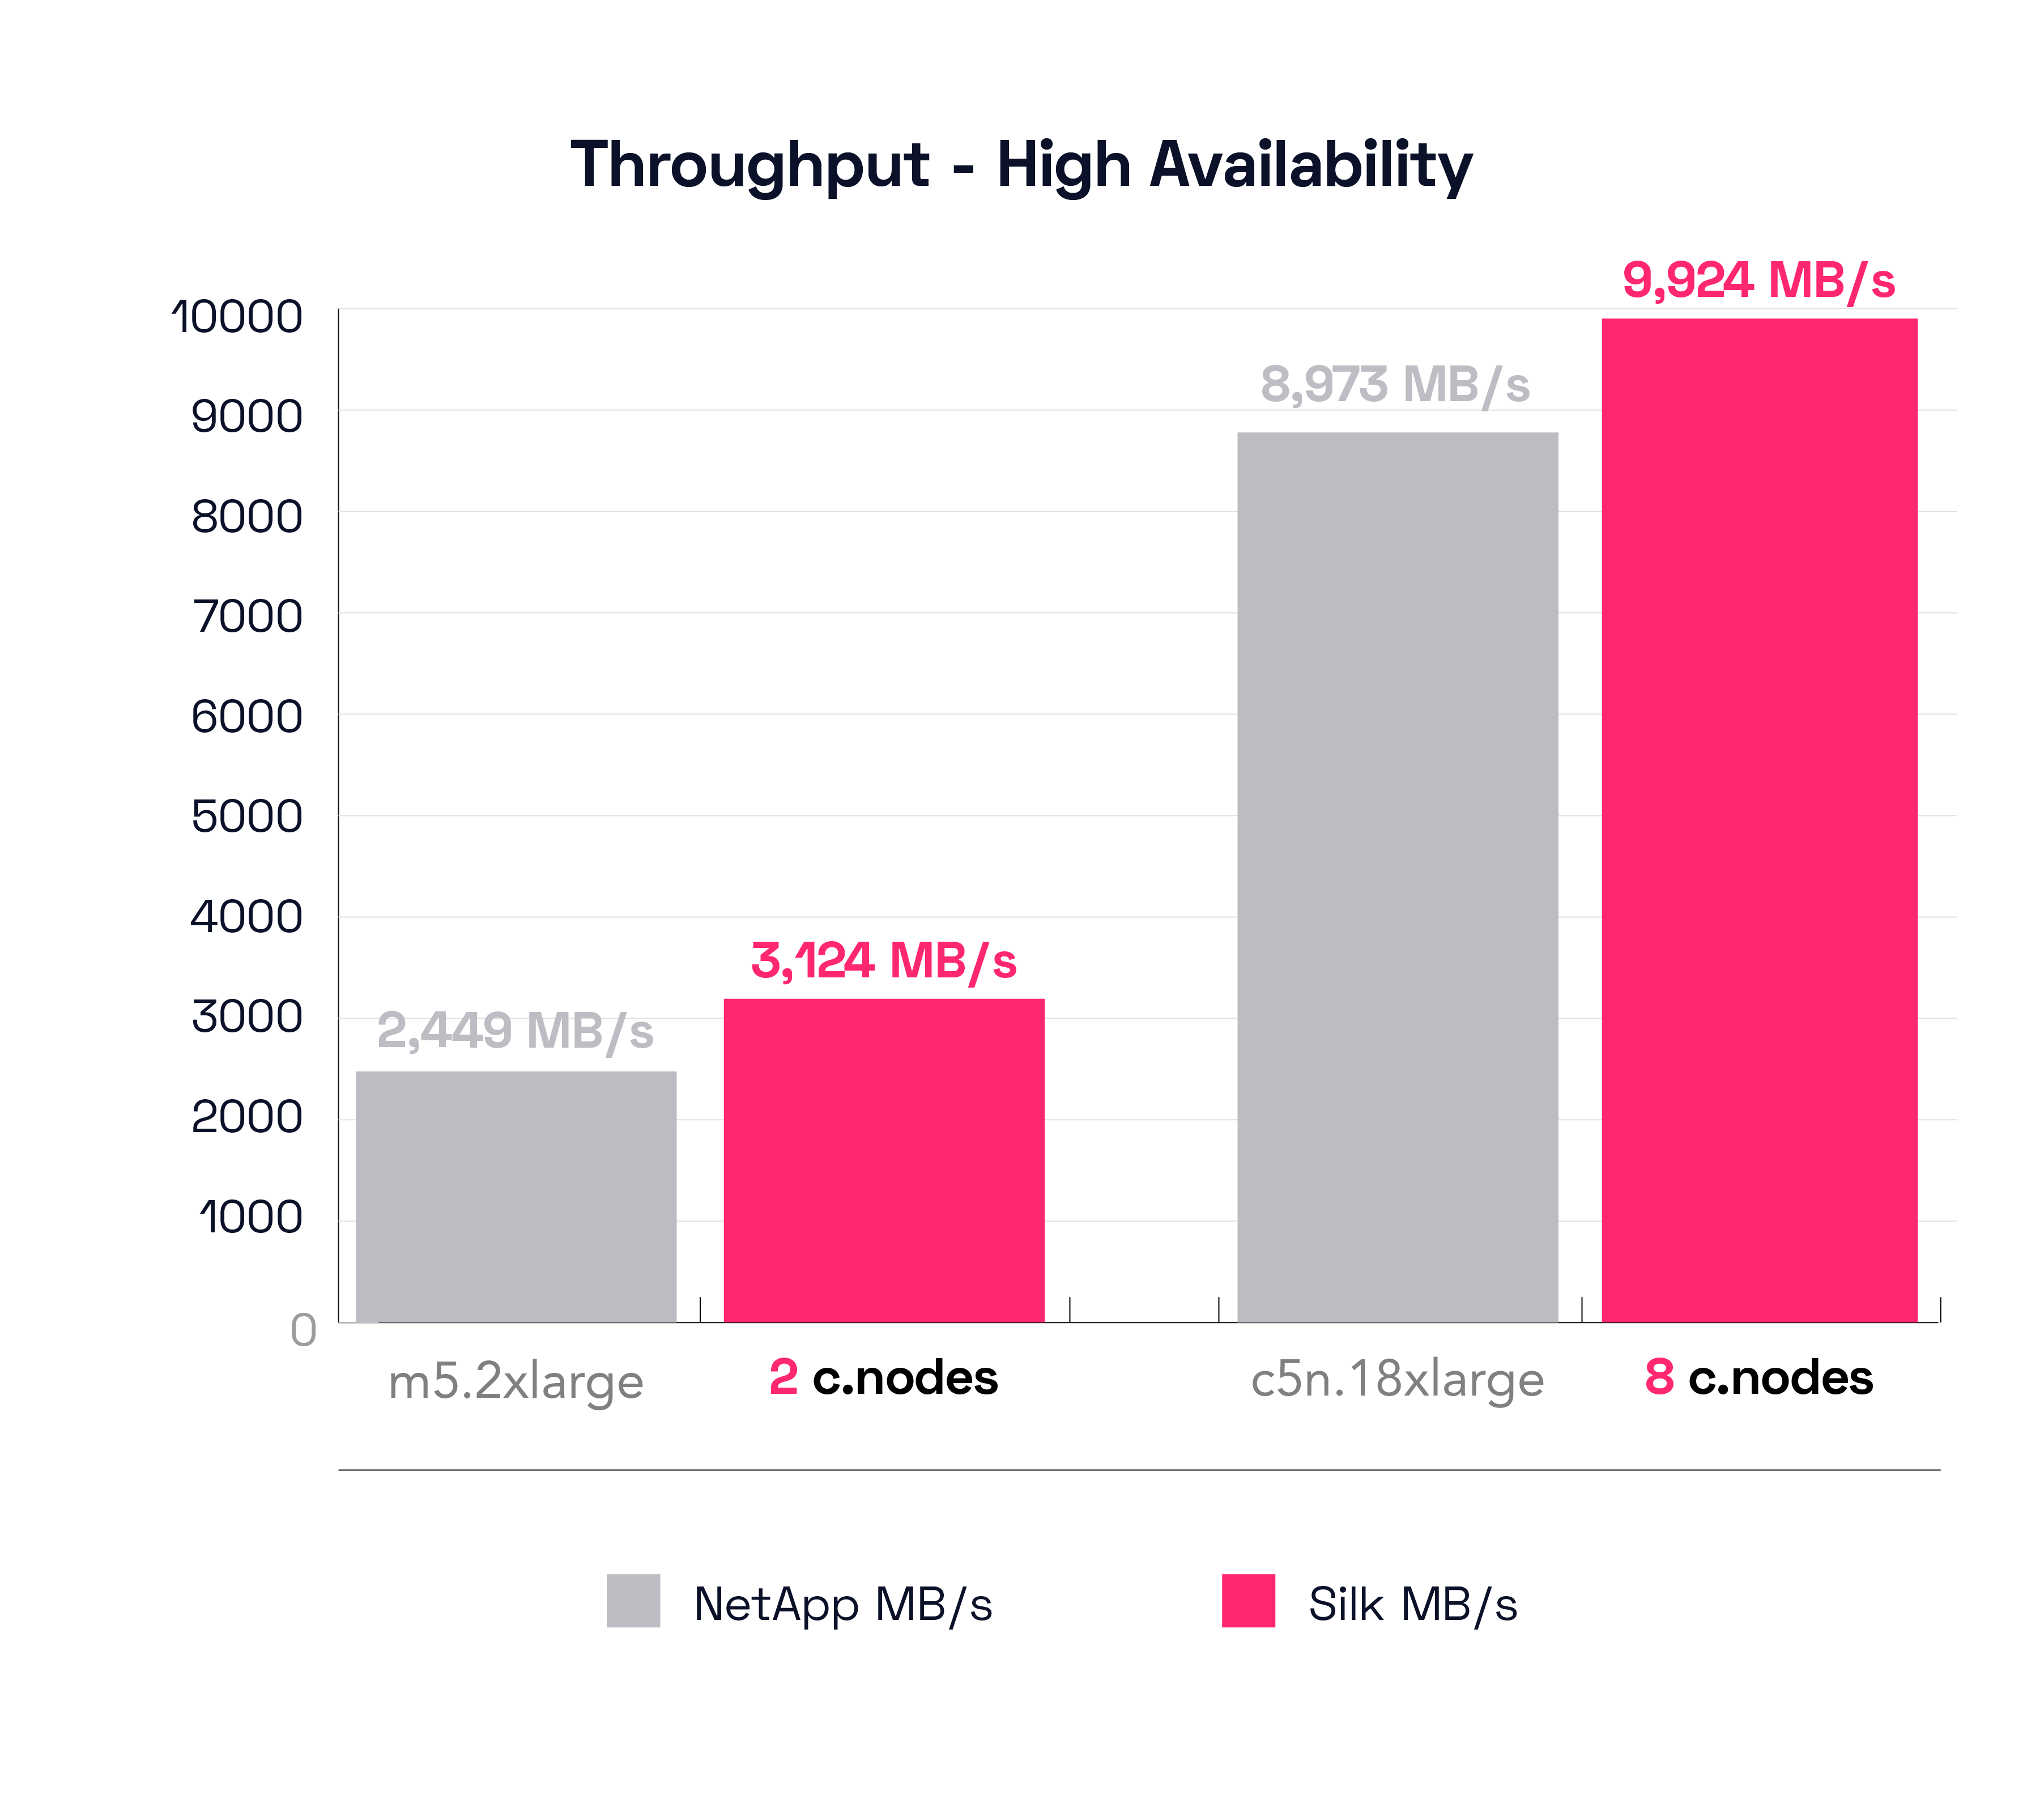
This result is what we expected, the NetApp platform performed well on sequential read tests with their HA config doubling both the data and controller footprint. We thought this would be their best overall result and it is. With that said, the Silk platform still outperforms NetApp on this test, with both the small and large configurations. We were also pleasantly surprised Silk was able to do so well with sequential workloads, as Silk is built more for random workloads (due to the Silk metadata schema being optimized for writing data everywhere across the entire data pod cluster, rather than sequencing data linearly, this is what makes Silk’s massively parallelized IO so fast while simultaneously keeping capacity usage extremely efficient). These results are great! But…
An Additional Test
We weren’t satisfied with just testing a 64K Sequential Read. We thought, let’s run this same test, but instead we will change the sequential profile to 100% randomized blocks. Why? Because large block random reads can be a major challenge for many platforms. Data fragmentation can create hot spots and bottlenecks, and large random data sets can defeat caching algorithms, which in turn creates extremely poor performance windows that are unpredictable and difficult to troubleshoot and fix. Large block requests can monopolize cycles, drowning out small block requests and cause significant wait states for time sensitive applications, or even timeouts, which are disastrous (the peak of the noisy neighbor problem). Data performance starts to become highly variable and unpredictable. Users become frustrated with the inconsistent experience because “sometimes it works fine and sometimes it’s terribly slow”. Silk architecture is designed specifically to avoid all of these problems.
Let’s take a look at how Silk performed on a large block random read test, which NetApp did not test for.
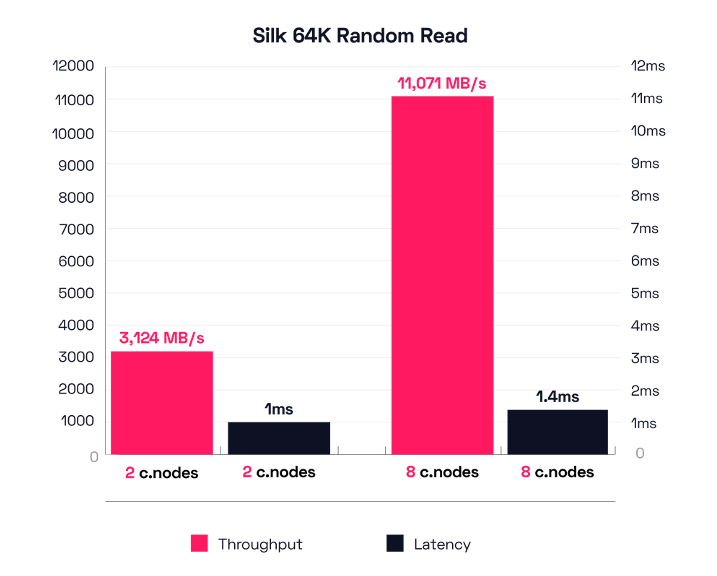
The Result – Random Read Throughput (64K block 100% Random Read)
In this 64K Random Read test, our smallest config (2 c.nodes) achieved 3,164 MB/s at 1ms latency (50,633 IOPS), which is about the same result from the sequential test and is excellent performance. But Silk’s largest configuration of 8 c.nodes was able to push a ridiculous 11,071 MB/s at a mere 1.4ms latency! That’s over 11 GigaBytes per second of completely random large block throughput at around 1ms of latency—in the public cloud. That’s far better performance numbers than what most on-premise storage platforms can do.
If you’ll indulge me, I’d like to now take a moment to explain a few nuances here.
First, Silk can do this on any cloud—GCP, AWS or Azure. This test is on AWS, but results are similar on the other two public cloud platforms (slightly more here, slightly less there). Second, we have data services enabled—thin provisioning, in-line compression, zero detect, encryption, and taking snapshots or turning on replication has zero impact on performance. We didn’t cripple or tweak any of the features or code base to achieve this result. Third, this is NOT a cached result. We run all our tests with caching parameters disabled, and the Silk platform has no read (or write) cache anyways. Silk does not have a cache engine. There is no cache-hit or cache-miss ratio on our platform because there is no cache. All reads come directly from the media node(s) every time, and all writes are committed immediately. Fourth, while caching can be useful, it’s basically a gimmick where you hope your hot data set is small enough to fit into the cache size. While this hope remains true, performance is good. When your hot data set exceeds the cache capacity (like with highly random data), your hope is lost, performance dies, the vanity of those gimmicky performance results are revealed, and the world suffers in pain (waiting for query responses). And then your vendor says: “to restore your lost hope, thou needest to buy more stuff”.
Questions? How can the Silk platform do this without a cache? And what about writes? Aren’t writes much harder than reads? And what about overhead, and resiliency, and workflow integration? What about the cost? All excellent questions, truly worthy of a deeper examination.
But for now, Here Endeth the Lesson. We shall pause and enjoy these results. After all, one must enjoy the journey and not just the destination. Next up we will take a close look at NetApp’s next test—Large block Sequential Writes. Don’t worry, we’ll expand that selection with a Random Write test as well, both for large and small block. The results will shock you!
After our next entry, we will arrive at the super heavy, complex, actual real-world workloads that showcase what the Silk platform can really enable for your most demanding mission-critical databases and customer-facing applications. Silk can do what no other platform can do—not Cloud native IaaS, not managed DBaaS, not NetApp, nor any other platform—deliver rich data services and autonomous high availability combined with monster IO and huge throughput at consistently dead flat-line low latency that superchargeseven the heaviest application and database workloads!