Choosing a platform that consistently delivers both maximum performance and availability in the public cloud is a bit of a challenge today. Cloud IaaS is good enough for general workloads, but it isn’t built to support the mission critical transactional apps that are time sensitive and are key to a great customer experience. Beneath the marketing hype, which vendor can actually deliver the highest performance with costs lower than cloud native IaaS?
At Silk, we want to make that decision a little easier for you. Using data from performance whitepapers that NetApp has published on their website in the past year, we’ve run a series of performance tests going head-to-head against their Cloud Volumes ONTAP (and Cloud Volumes Service too) to show you how we stacked up.
In the first blog post in this series, we’ll take a look at how Silk and NetApp compare by testing how each performs with a hero number–4K Random Read on AWS. Don’t worry, we’ve run 10 more tests comprising all sorts of workloads—including VSI, VDI, SQL and Oracle real world loads that we’ll publish, along with a head-to-head comparison of the five tests NetApp ran in their paper.
How Silk and NetApp Differ
Before we dive in, you should know a bit how both the Silk and the NetApp architectures are built. NetApp Cloud Volumes ONTAP is using a classic single controller architecture (single node) with 12 EBS disks split into two aggregates, and also a High Availability mode which uses two controllers (active-active with sync-mirror). The HA element kicks in if one controller fails, but they did not test that. So really the HA mode workload tests are just using two controllers serving IO from two groups of six mirrored (using synchronous replication) EBS disk-based aggregates, and then they report the two combined results from the host perspective. They are also occasionally using a “high write” mode which turns OFF write consistency (if there’s a problem there is data loss). The “high” mode makes all the IO faster, but of course there’s no data protection in case of sudden failure, so it would have limited use in an enterprise production environment, and it doesn’t have a use case here certainly—except maybe to highlight what a large performance hit write protection inflicts on the NetApp system. The NetApp controllers are running on a variety of different compute engines, each with different amounts of vCPUs and DRAM. The level of read performance varies wildly with the amount of memory available.
The Silk platform is a modern symmetric active-active platform using (in these tests) 2, 4, 6 or 8 nodes (c.nodes) in a cluster, which simultaneously serve IO from a single 40TB pool of storage. The storage pool is located on a persistent media node (m.node), which is (virtually) built from a number of data nodes (virtual SSDs created from small VMs using ephemeral local NVMe disks) that are protected by write-mirroring, erasure coding and triple parity. The Silk platform always has HA “mode” enabled with full data protection on as a baseline. The number of nodes impacts the amount of IO that can be served, and Silk can serve IO from any single volume across any node(s). The amount of nodes can be scaled out or in automatically and non-disruptively from 2-8 (2,3,4,5,6,7 or 8 nodes currently supported) to deliver just the proper amount of performance on-demand while keeping costs in line.
For this test, we compared the various configurations of the Silk platform – from the smallest (2 nodes) to the largest (8 nodes) on AWS and compared those results to the entire group of NetApp Cloud Volumes ONTAP configurations. For the full report, see our white paper for details of the entire configuration, environment and test harness profiles. These blog posts are based on excerpts from that paper.
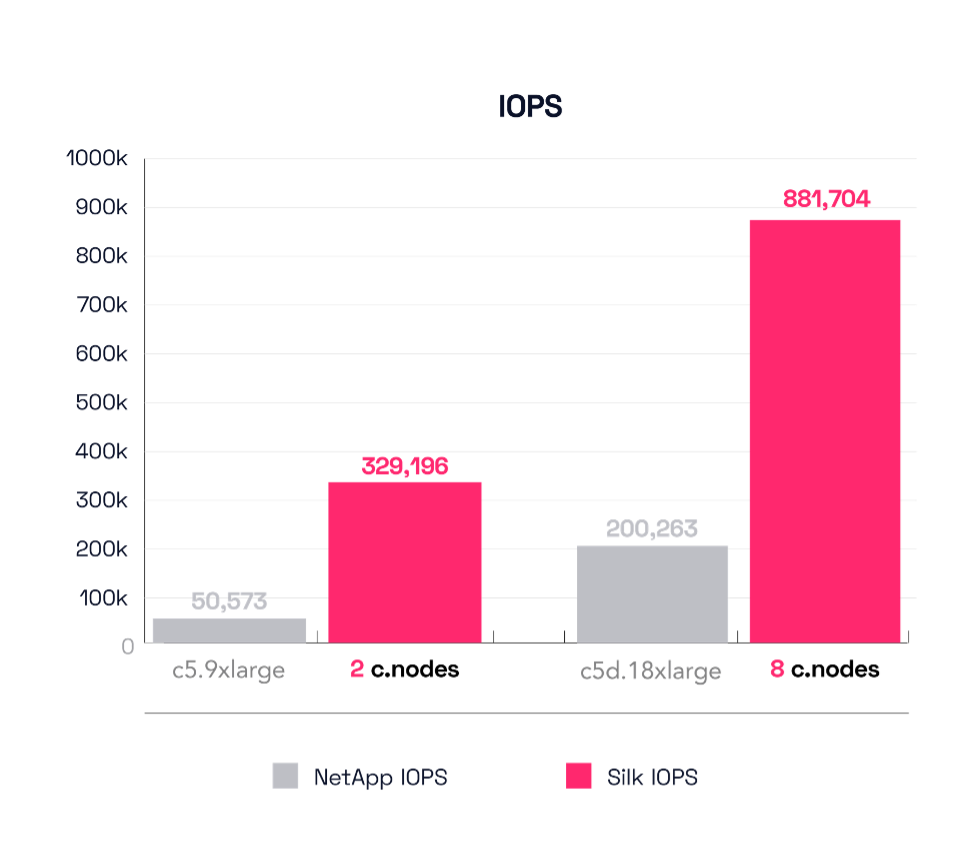
The Test Results – 4K block size, 100% reads, and 100% random access I/O, Single Node
The first test NetApp ran was a 4K random read test as mentioned. This first graph shows IOPS. We first see the two smallest configurations—Silk’s 2 cnode vs the NetApp c5.9xlarge configuration. Silk pushes a monster 329,000 IOPS, while the NetApp comes in at 50,537 IOPS (85% less). For the big config, Silk deploys 8 c.nodes compared to the NetApp c5d.18xlarge. Silk delivers a huge 881,000 IOPS in this config compared to 200,263 for the NetApp.
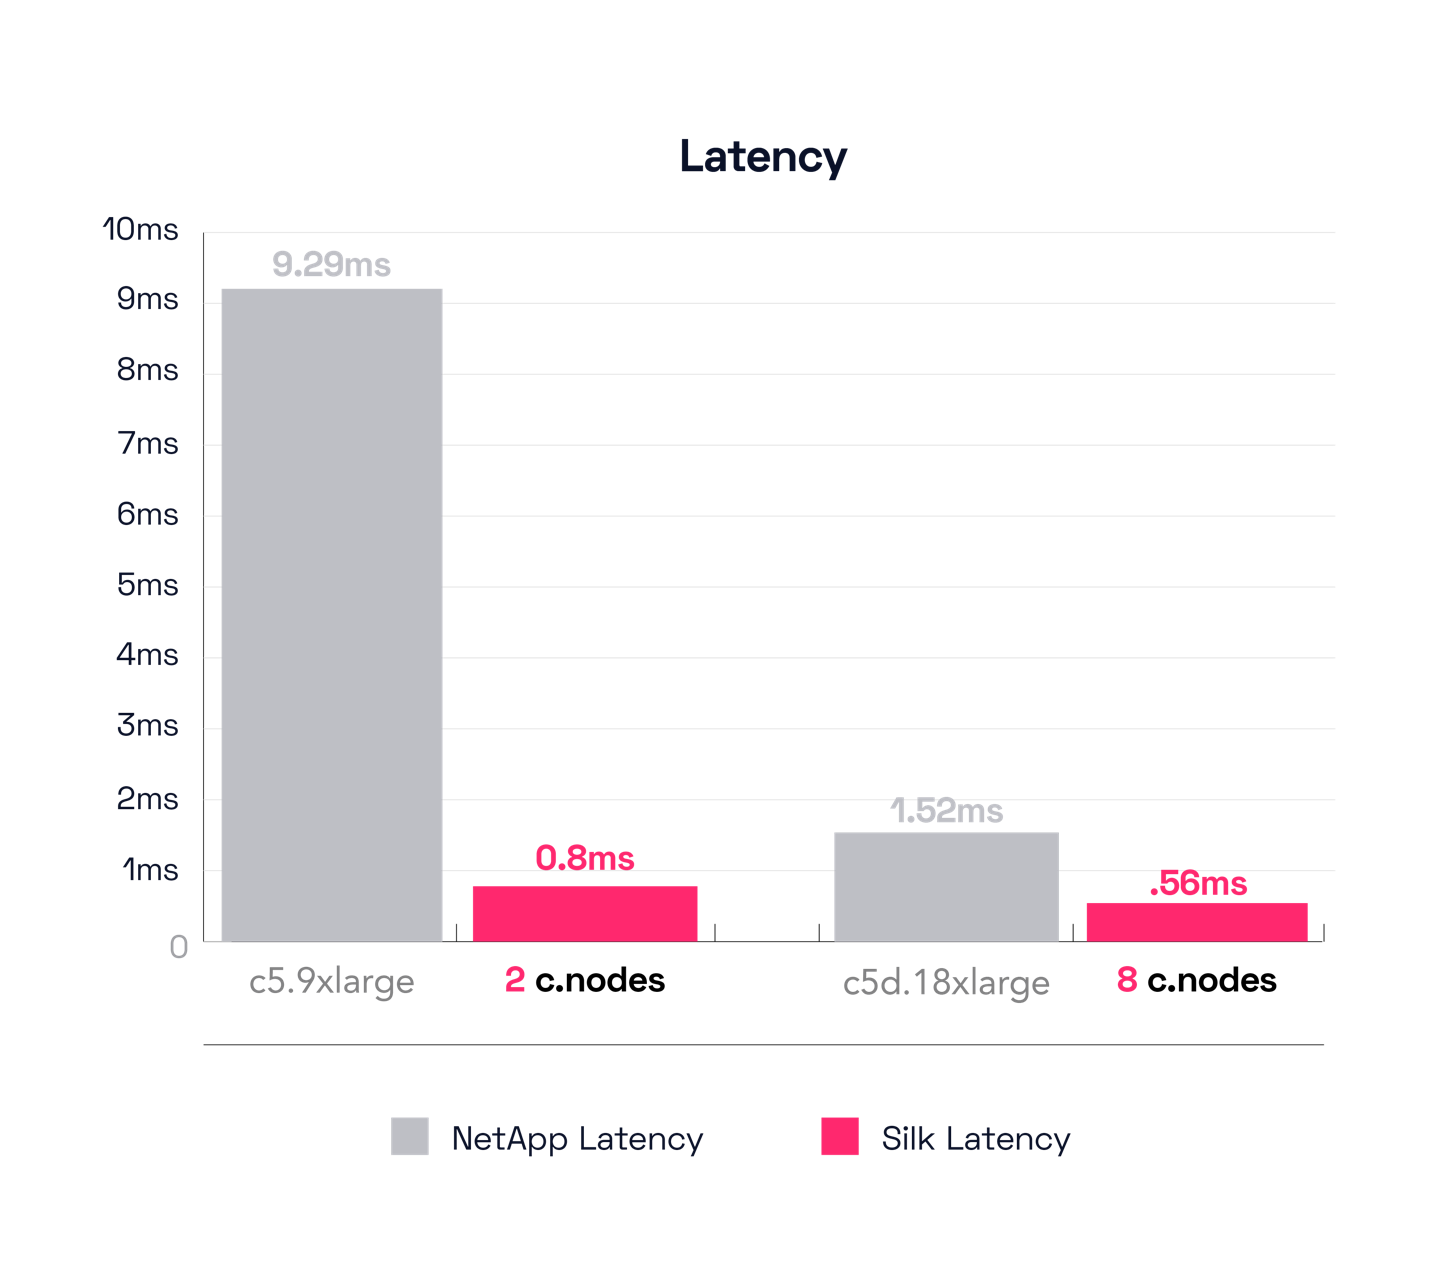
Our next graph shows the IO latency, because while having enough IO is very important, the time it takes to deliver that IO to transactional systems is really the more important number. The Silk solution is consistently much quicker, with the 2 cnode system delivering IO in 800 microseconds (.8ms) while the NetApp clocks in at 9.29ms(!) latency. Almost 10ms latency for 4K reads is… unusable? Just our opinion. The large Silk config is even more impressive, delivering almost 900,000 IOPS at 560 microseconds (.56ms) latency. The large NetApp does much better here but can still only get to 1520 microseconds (1.52ms) latency, 3x slower than the Silk.
In our humble, reasonable, expert opinion, the Silk result of 560 microseconds for almost 900K IOPS is sparkling—and that includes enterprise data protection, full redundancy, inline compression, thin provisioning, write mirroring, zero detection, encryption and other data services that are always enabled.
The (HA) Test Results – 4K block size, 100% reads, and 100% random access I/O – Multi Node
Not to be unfair, NetApp also tested their High Availability Mode (two controllers with 2 aggregates set up in a sync mirror with active-active IO on the front end). We will also compare all the tests we did with their HA mode configuration—that mode should fare much better with read only test profiles (since NetApp’s architecture is basically built to be a read caching engine, 100% read tests should produce a great result). By contrast, the Silk platform uses no caching whatsoever and is not dependent on cache hit/miss ratios to produce high performance. The Silk architecture produces consistently flat latency regardless of the size or variability of the “hot” workload skews and different read vs write ratios.
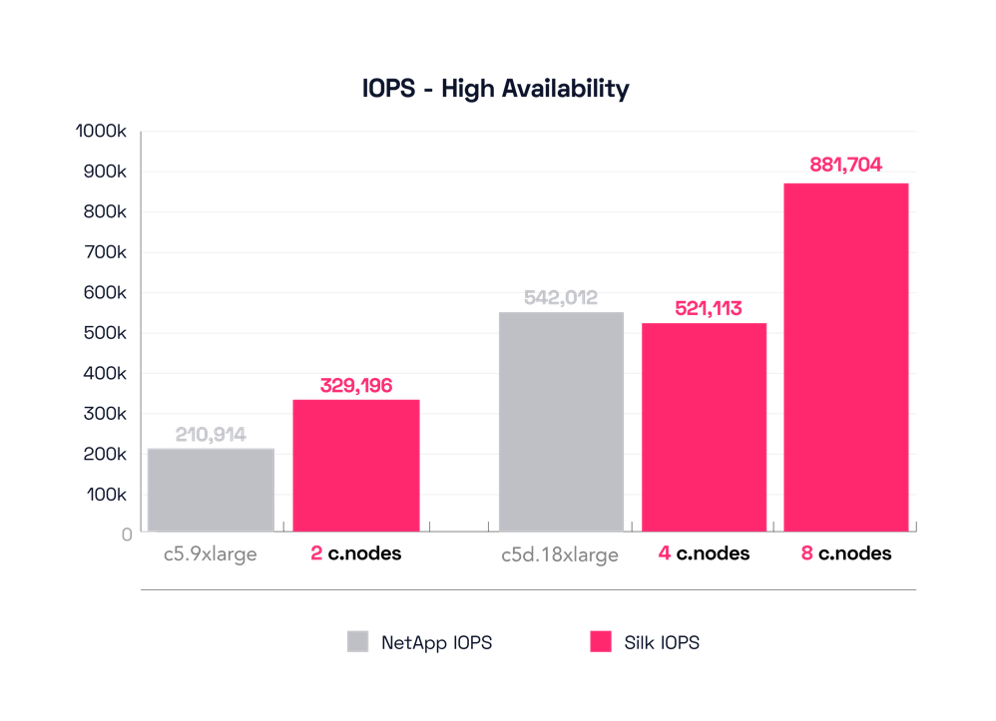
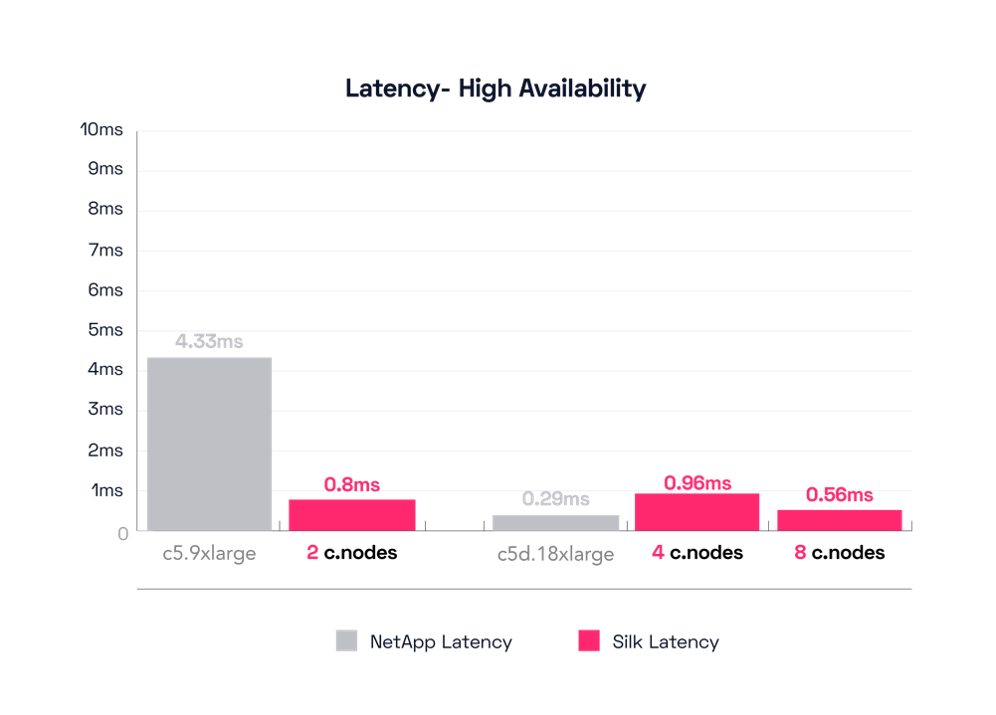
NetApp’s c5.9xlarge engine config produces 210,914 IOPS at 4330 microseconds (4.3ms) latency, still 40% fewer IOPS than Silk’s smallest 2 cnode configuration, and at ~5x higher latency. 200K IOPS is nice for a small config, but over 4ms latency on small block reads is rough—in our aforementioned described opinion. Let’s look at their biggest config, the c5d.18xlarge. This produces a result much more like what we expected: 542,012 IOPS at 290 microseconds (.29ms), a quite respectable result. Silk matches that with our 4 cnode configuration, which pushes 520,000 IOPS at 900 microseconds, a fair comparison. Of course, Silk can continue to scale far beyond this, increasing up to almost 900K IOPS at 500 microseconds, leaving NetApp’s strongest configuration in the dust.
Now, we readily acknowledge that small block 4K reads are a hero number and not a true test of the enterprise abilities of a data platform to service IO while providing rich data services–but it’s a fun place to start! At least it is for Silk, demonstrably so. Our next entries will progressively dig into heavier, more complex, and eventually actual real-world workloads that showcase what our platform can really enable for your most demanding mission critical databases and customer facing applications. Silk can do what no other platform can do—not Cloud native IaaS, not managed DBaaS, not NetApp, nor any other platform—deliver rich data services and autonomous high availability combined with consistently monster IO and gonzo throughput with dead flat-line low latency that supercharges even the heaviest application and database workloads!
Keep an eye out in the coming weeks as we continue to share the results of additional performance testing we’ve conducted against both NetApp CVO and Cloud Volumes Service. Until then, Silk and chill.