Last week, we shared with you the first installment of a series of blogs where we are going head-to-head with NetApp on performance tests they conducted on AWS IaaS – the results of which they published on their website.
In our first test, we looked at how Silk compared to NetApp when it comes to 4K random reads as a basic measure of “how many IOPS can this thing push”. As we said in that post, in the real world 100% 4K random reads are not representative of a normal workload, but it’s a fun place to start (and everyone posts hero numbers like this as a common starting point).
This week, we’re taking a look at the second performance test (of five) that NetApp conducted on AWS. This profile is about IOPS again, but a slightly more real-world measure of IOPS as we have increased the block size to 8K and made the IO ratio 80/20 read/write. IO pattern is still 100% random. This test is called “Transactional/OLTP” and is more representative of databases that are handling lots of small transactions without a pattern in a highly concurrent fashion.
The amount of IO you can process at very low latency is the primary metric, as these databases are typically real-time response driven user/customer facing and the ability to deliver a consistently high user experience through fast response (low latency) while handling highly unpredictable and potentially really spiky IO loads is what is important here.
How Silk and NetApp Differ
Now remember what I said in my previous blog about how Silk and NetApp’s architectures differ—I will refer you back to that post rather than review it all again. Briefly, the Silk platform is a modern, auto-scalable, symmetric active-active architecture that delivers extreme performance across any workload profile by leveraging cloud native IaaS components.
For our test today, we used an 8K block size with an 80/20 R/W ratio in a 100% random access pattern. We compare the various configurations of the Silk platform – from the smallest (2 c.nodes) to the largest (8 c.nodes) – and see how they match up to the full breadth of the NetApp Cloud Volumes ONTAP configurations tested in the white paper.
The Results – Transactional/OLTP (8K 100% random 80/20 R/W – Single Node)

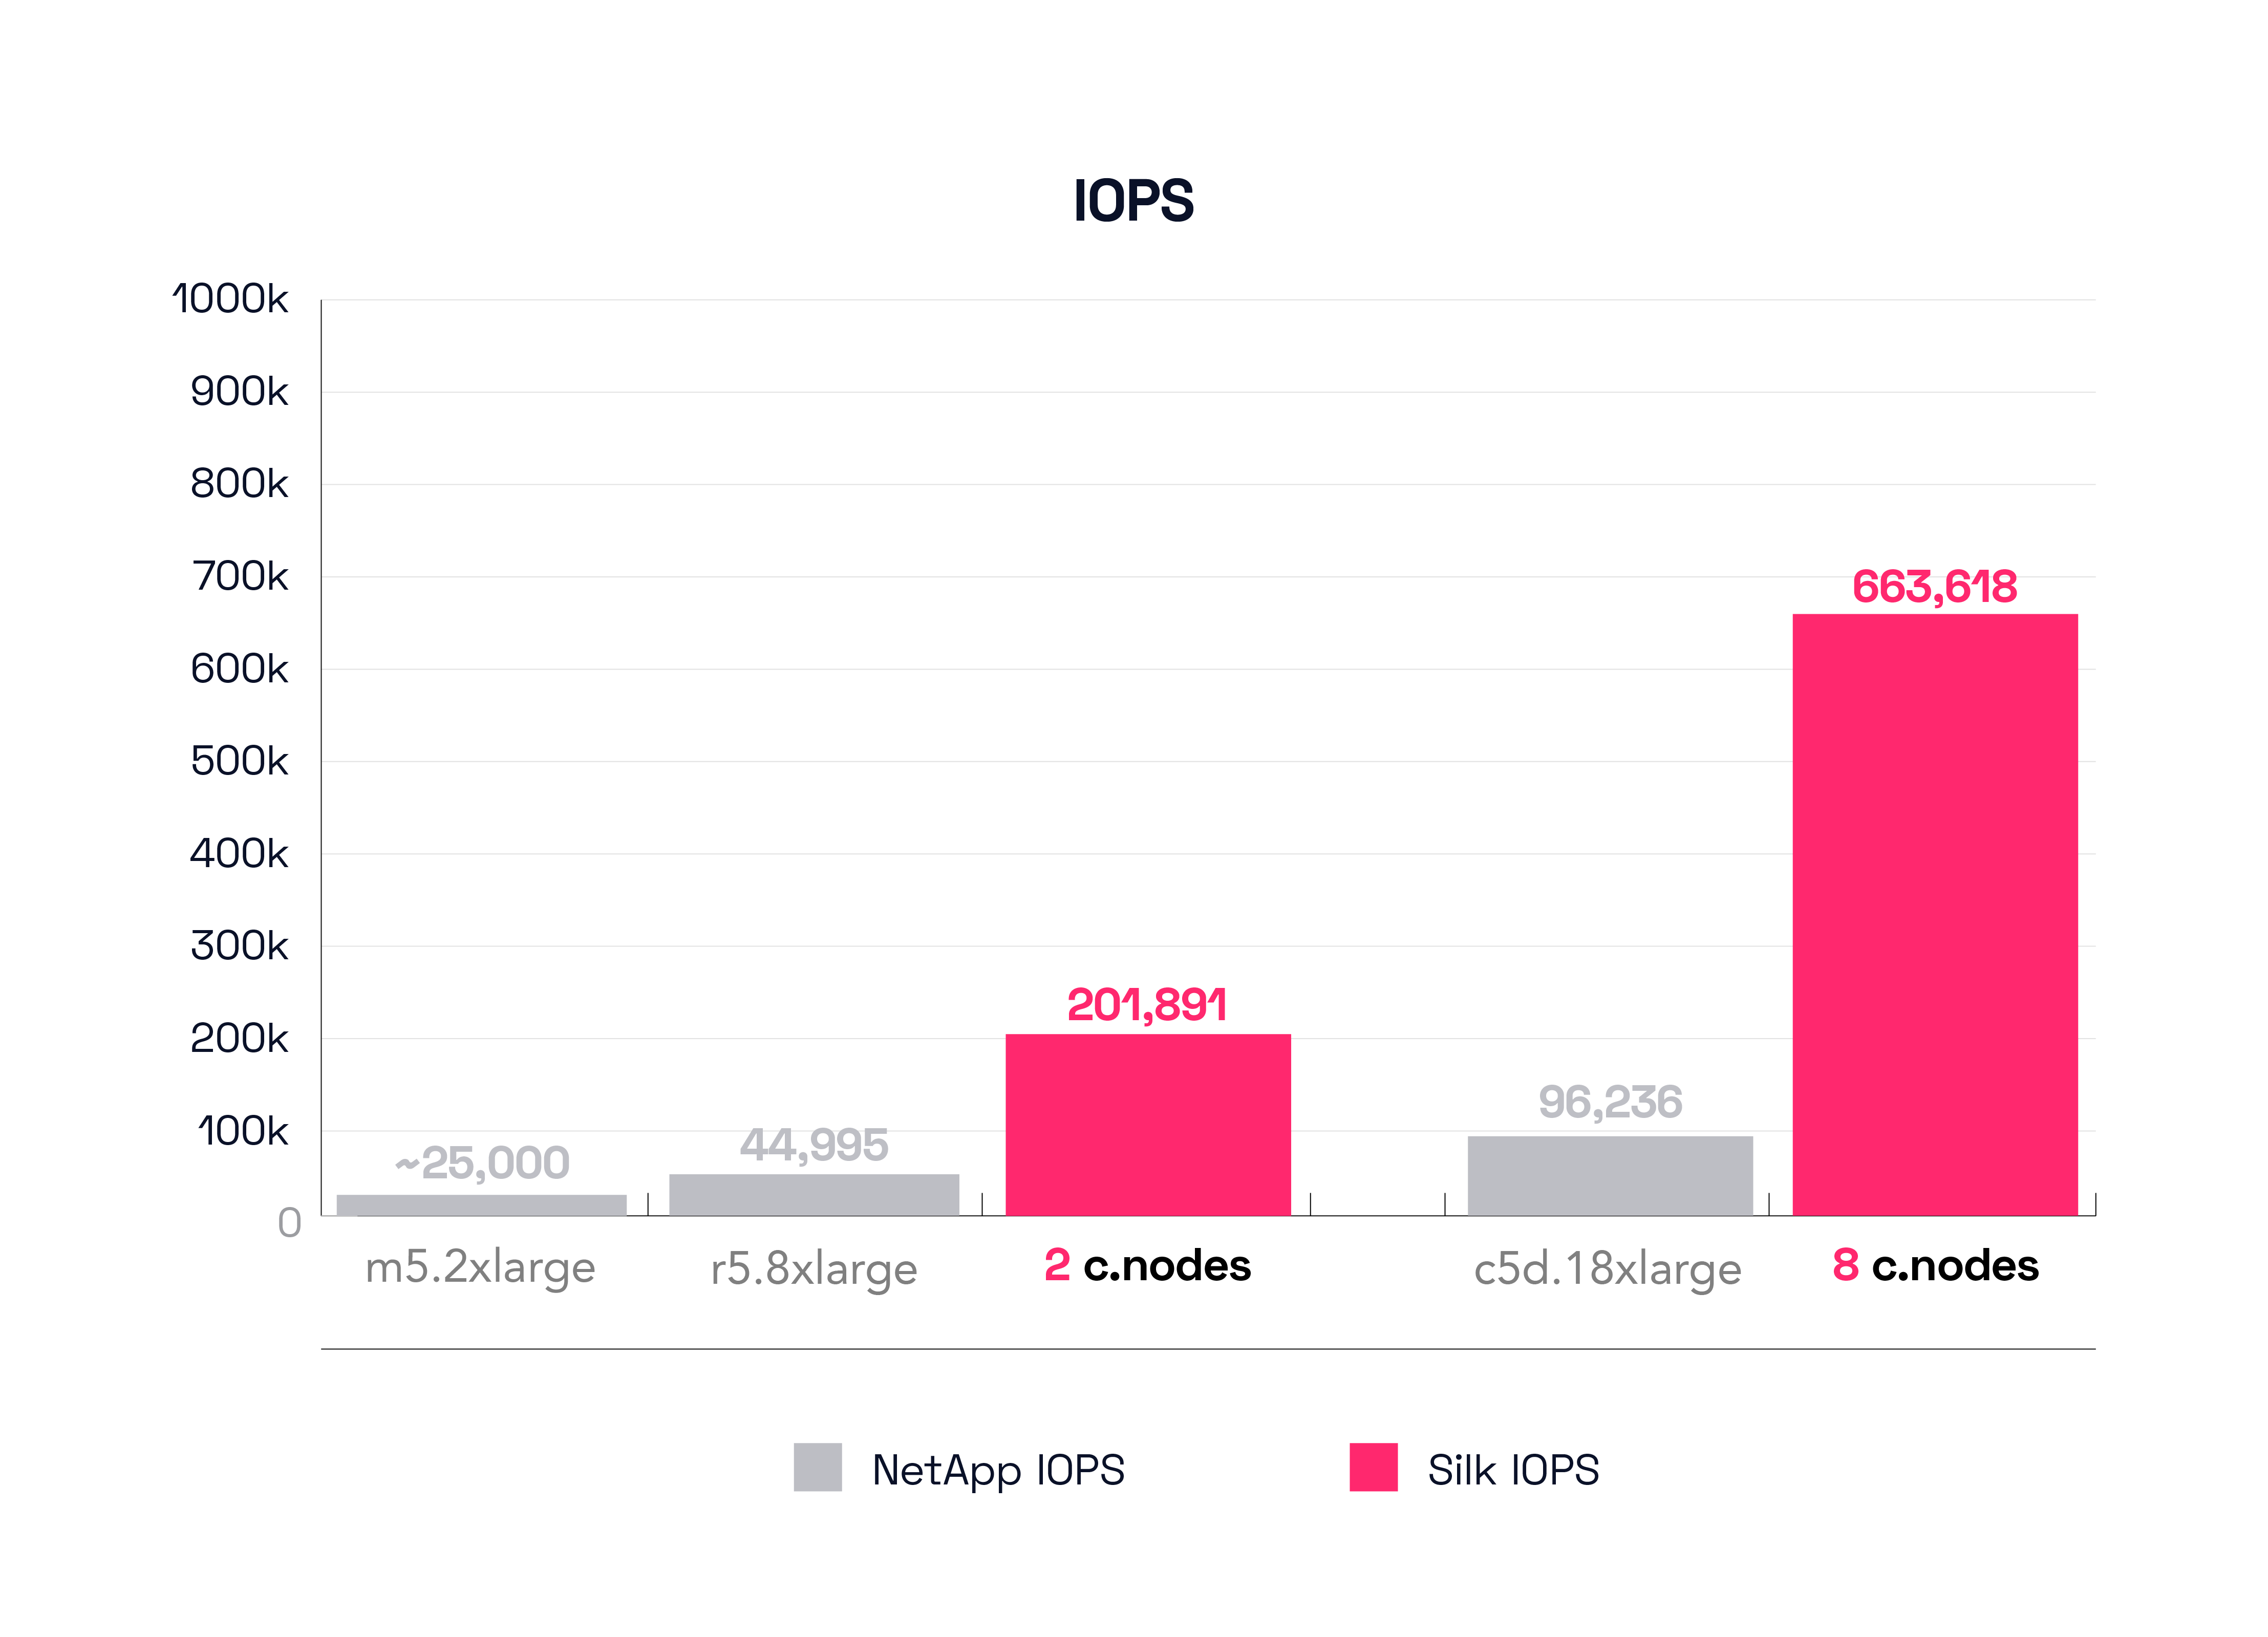
As mentioned, for this test, the important things are the amount of IOPS and the latency to deliver those IOPS. This first result graph shows IOPS. We first see the two smallest configurations—Silk’s 2 c.node vs the NetApp m5.2xlarge configuration. This test result is a little odd because while the NetApp test graphs show a result of about 25,000 IOPS for the m5.2xlarge config they do not list it in their results details chart—perhaps it was just an oversight—so we’ll also look at the next closest small config result, the r5.8xlarge, which is shown in both charts. That config delivers 44,995 IOPS, almost 40% more than the m5.2xlarge. Our smallest Silk config by contrast pushes 201,891 IOPS, which is either 720% more IOPS or 450% more IOPS depending on which NetApp config you wish to compare to. Either way, it’s a major delta.
Next, we’ll look at the largest configurations tested. Here, Silk deploys 8 c.nodes compared to the NetApp c5d.18xlarge. The Silk platform again delivers a monster result of 663,618 IOPS, while the biggest NetApp config is able to drive 96,236 IOPS. Silk’s true symmetric active-active architecture is doing this with all normal data services turned on—compression, encryption, thin-provisioning, zero-detect, etc. and can do this during instant snapshot creation/mount/tear down and active replication to another Silk Data Pod. In this test, Silk delivers about 700% more performance! Very nice—but as we know, transactional workloads are really all about consistent low latency. IOPS are (of course) extremely important in that. . . .well, you simply must have enough of them, or response times suffer. But, if you have enough IOPS, then the more important metric is “how quickly is the application getting the data”, which is measured in latency. We’ll take a look at that result next.
Our next graph shows the IO latency, the really important number. Think of IOPS and latency like a race car. Race cars need high top speeds, but how quickly they can corner and maneuver in the turns is also extremely important. Granted, if your straightaway top speed is less than half of your competition, you probably aren’t qualifying—ever. However, if you have a great top speed but are really slow in the turns, you’ll also find yourself watching from the stands instead of racing on race day. IOPS are like top speed—must have it. Latency is the cornering and handling—must have that too. Let’s take a look at how well the systems handle the IOPS in the turns.

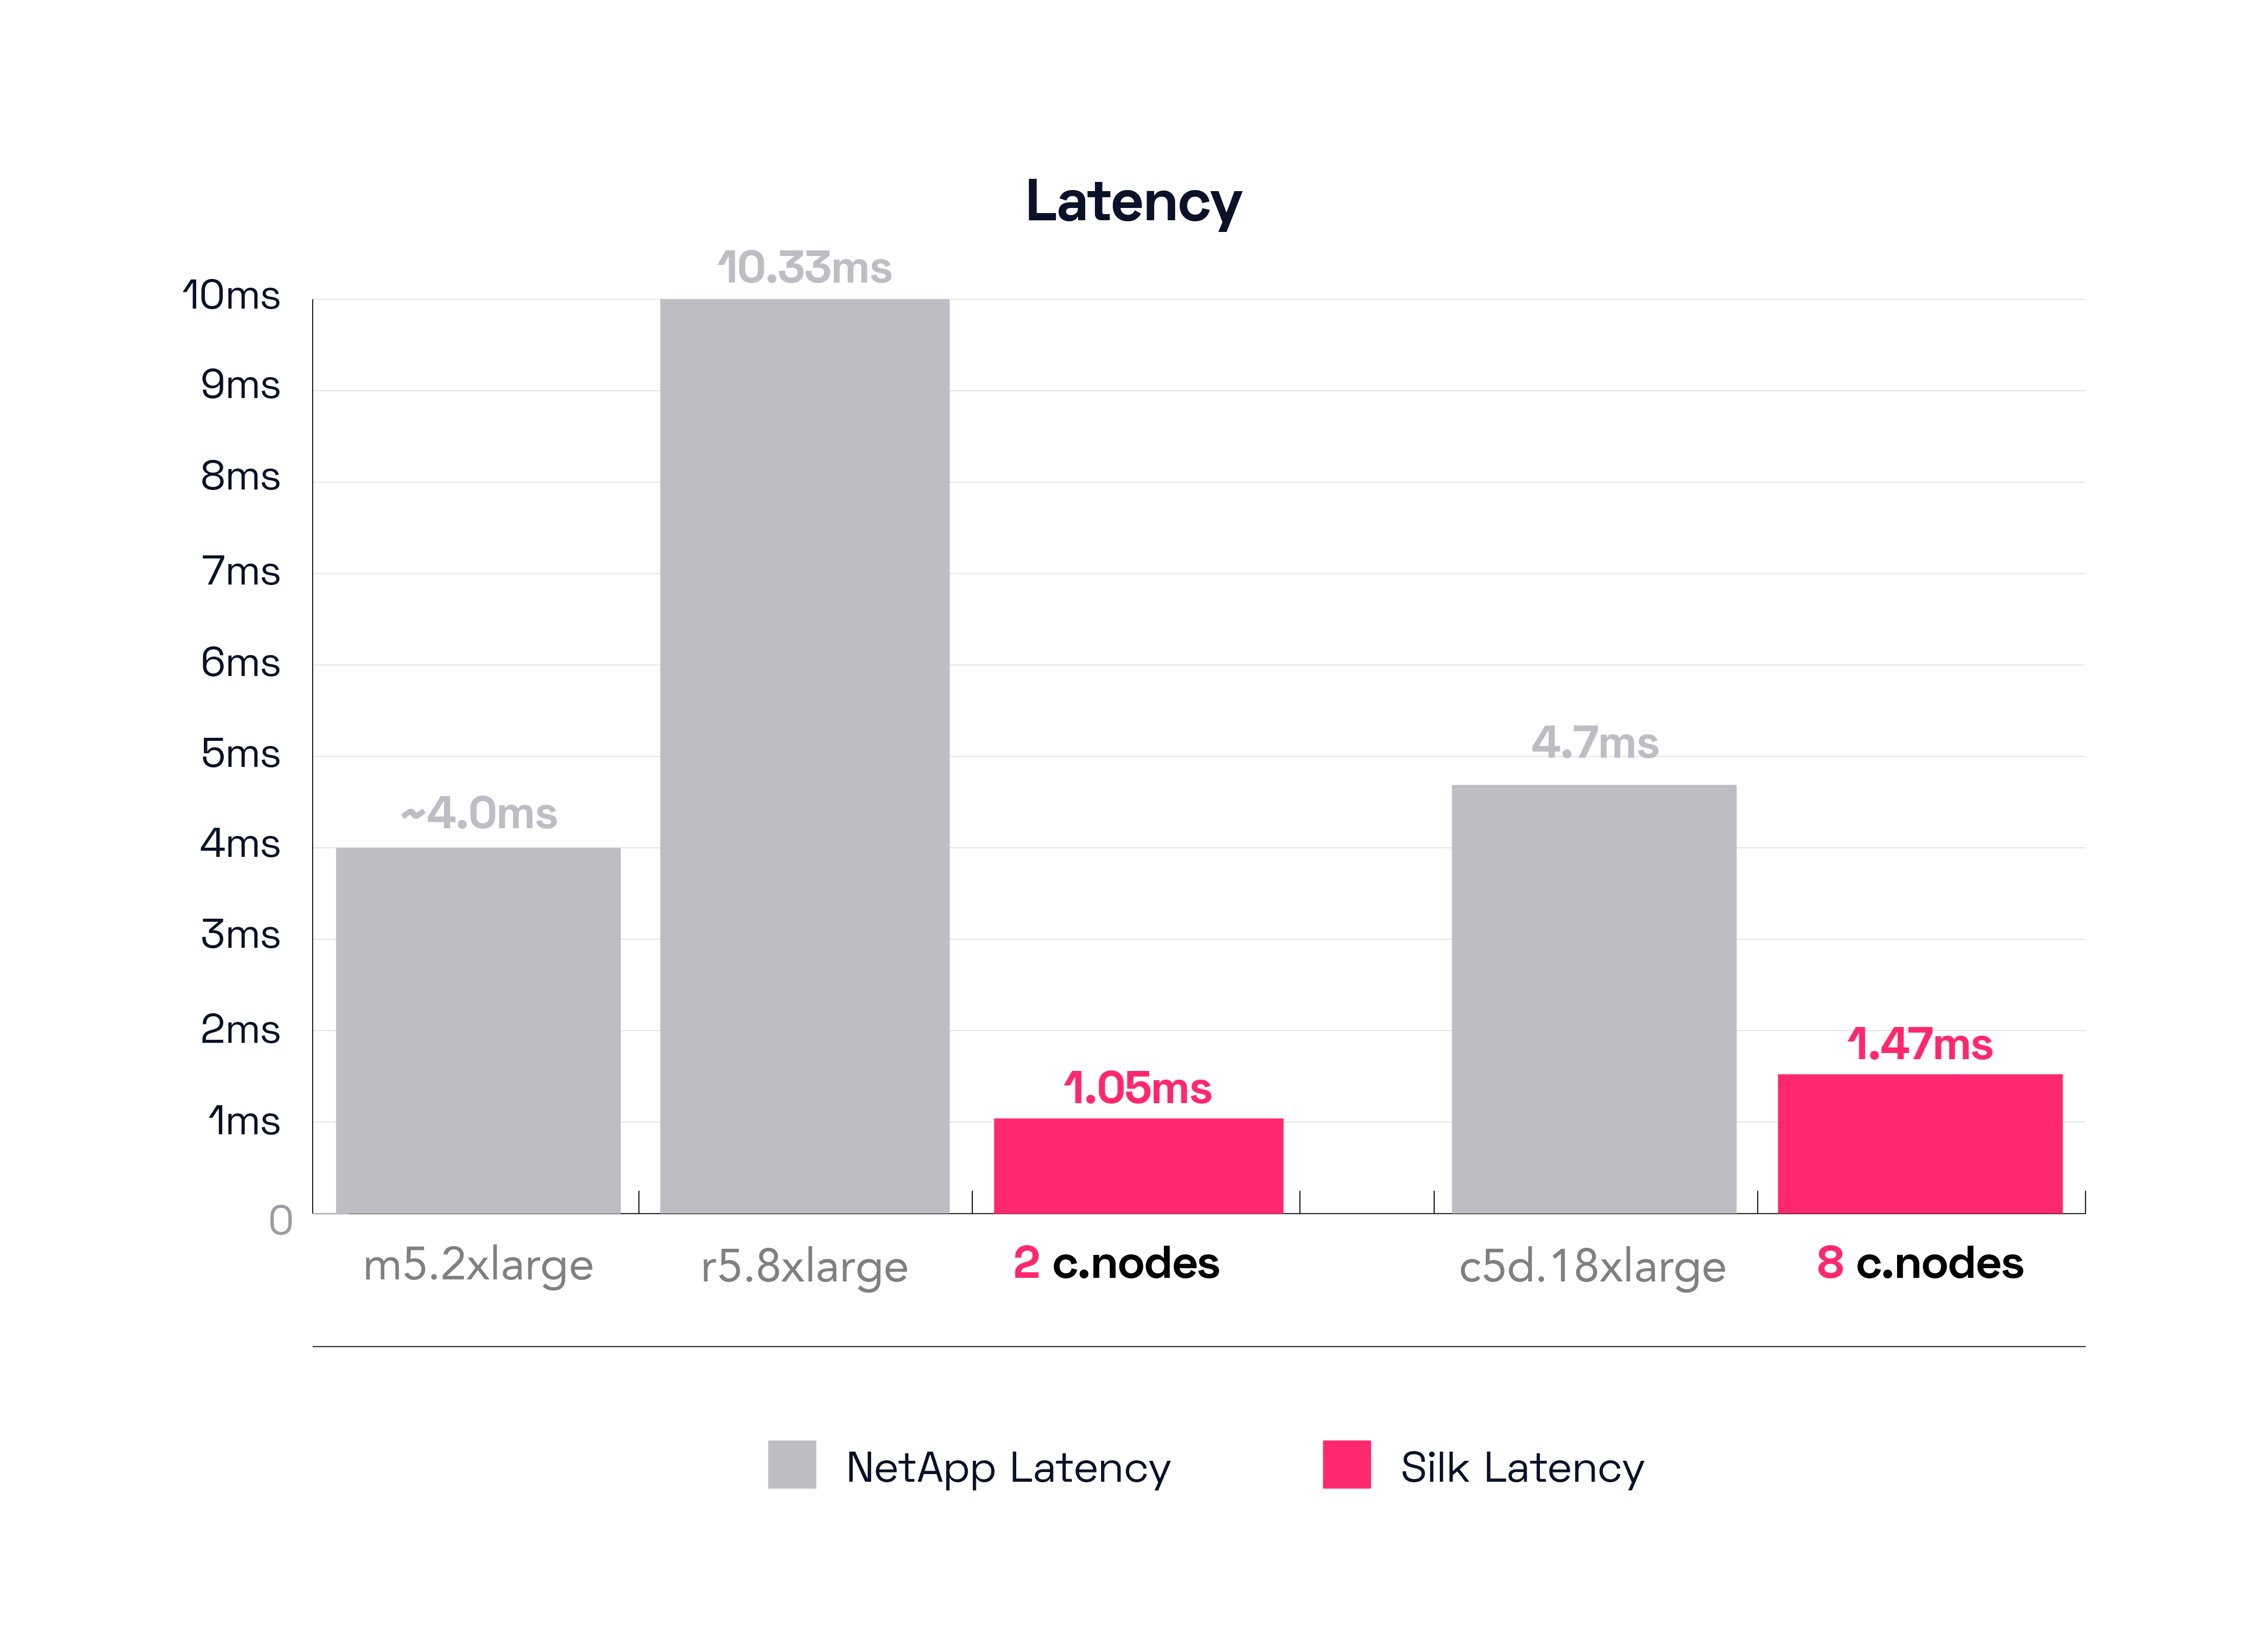
The small NetApp configs are either running at 4ms latency (m5.2xlarge) or 10.33ms latency (r5.x8large), neither of those results are remotely acceptable for a transactional application, in our opinion. The small Silk data pod is again exceptionally quick, with the 2 c.node system delivering IO in 1050 microseconds (1ms), which is either 1/10th or 1/4th the amount of time the NetApp is taking. Maybe you prefer we say that Silk is 10x faster? Whichever way you want to measure it, Silk is very quick in the turns, even under extremely heavy loads.
Let’s look the large NetApp configuration comparisons now. The big 8 node Silk config is delivering those 663K IOPS at 1.4ms, compared to the large NetApp (c5d.18xlarge) which is taking 4.7ms, which is over 3x slower than the Silk. While we generally don’t measure throughput for IOPS tests, just as an FYI, Silk’s 663,000 IOPS of 8K blocks equates to over 5GB/s of throughput, while the big NetApp is pushing only 770 MB/s or .77GB/s. The Silk platform is made to order for large scale database applications with high performance requirements.
The (HA) Test Results – 8K block size, 80/20 R/W, 100% random access I/O – Multi Node
As we did last week, we don’t want to be unfair, and we told you that NetApp has also tested their High Availability Mode (two controllers with 2 aggregates set up in a sync mirror with active-active IO on the front end). Same tests, with double the IaaS footprint. We are also comparing all the tests we did with their HA mode configuration, because in enterprise production, most everyone (usually) will want a more available, more resilient platform. As a reminder, Silk is always at least N-way and HA, scalable from 2-8 nodes (or more, if you really need it), and architected for 99.999% uptime.
The HA test result should be quite significant here, as the way the Silk platform protects writes across the c.nodes is extremely fast, even faster than reads, while the old legacy NetApp sync mirror architecture was—in our opinion–not really built with low latency in mind. We shall see here right now, with our first test that measures (even just a little bit, with small blocks) write latency. Ooh it’s exciting!

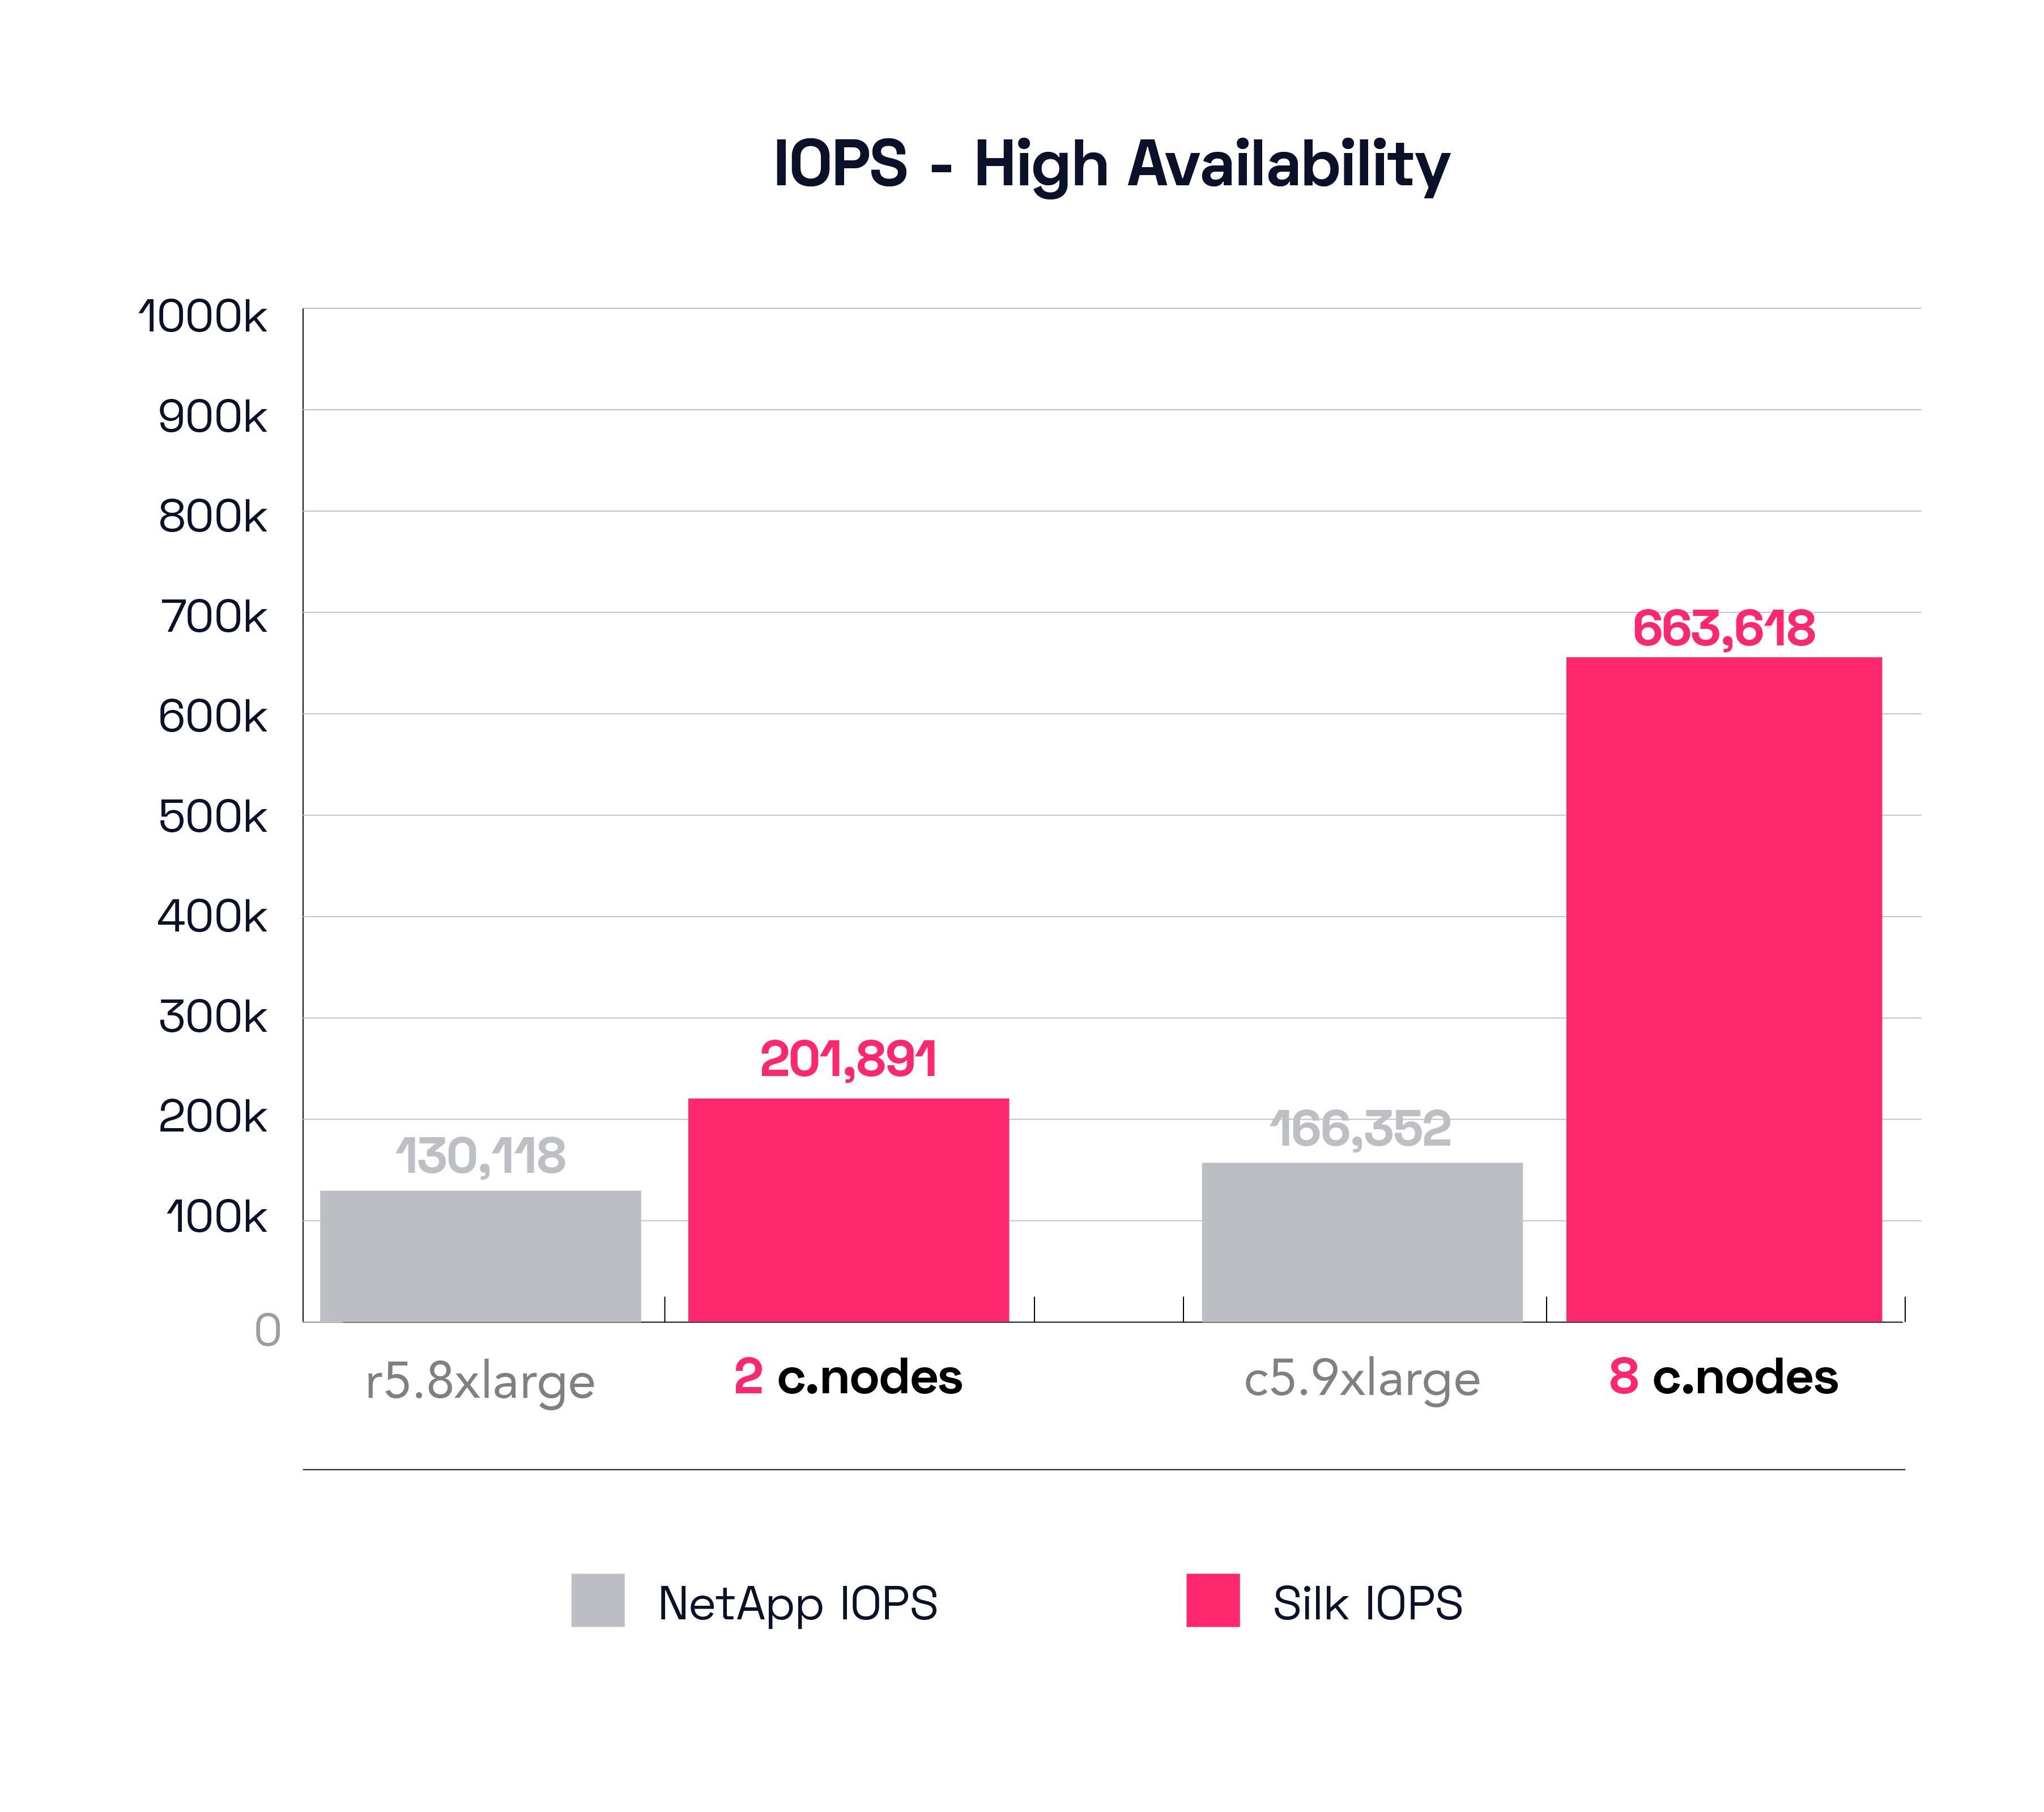
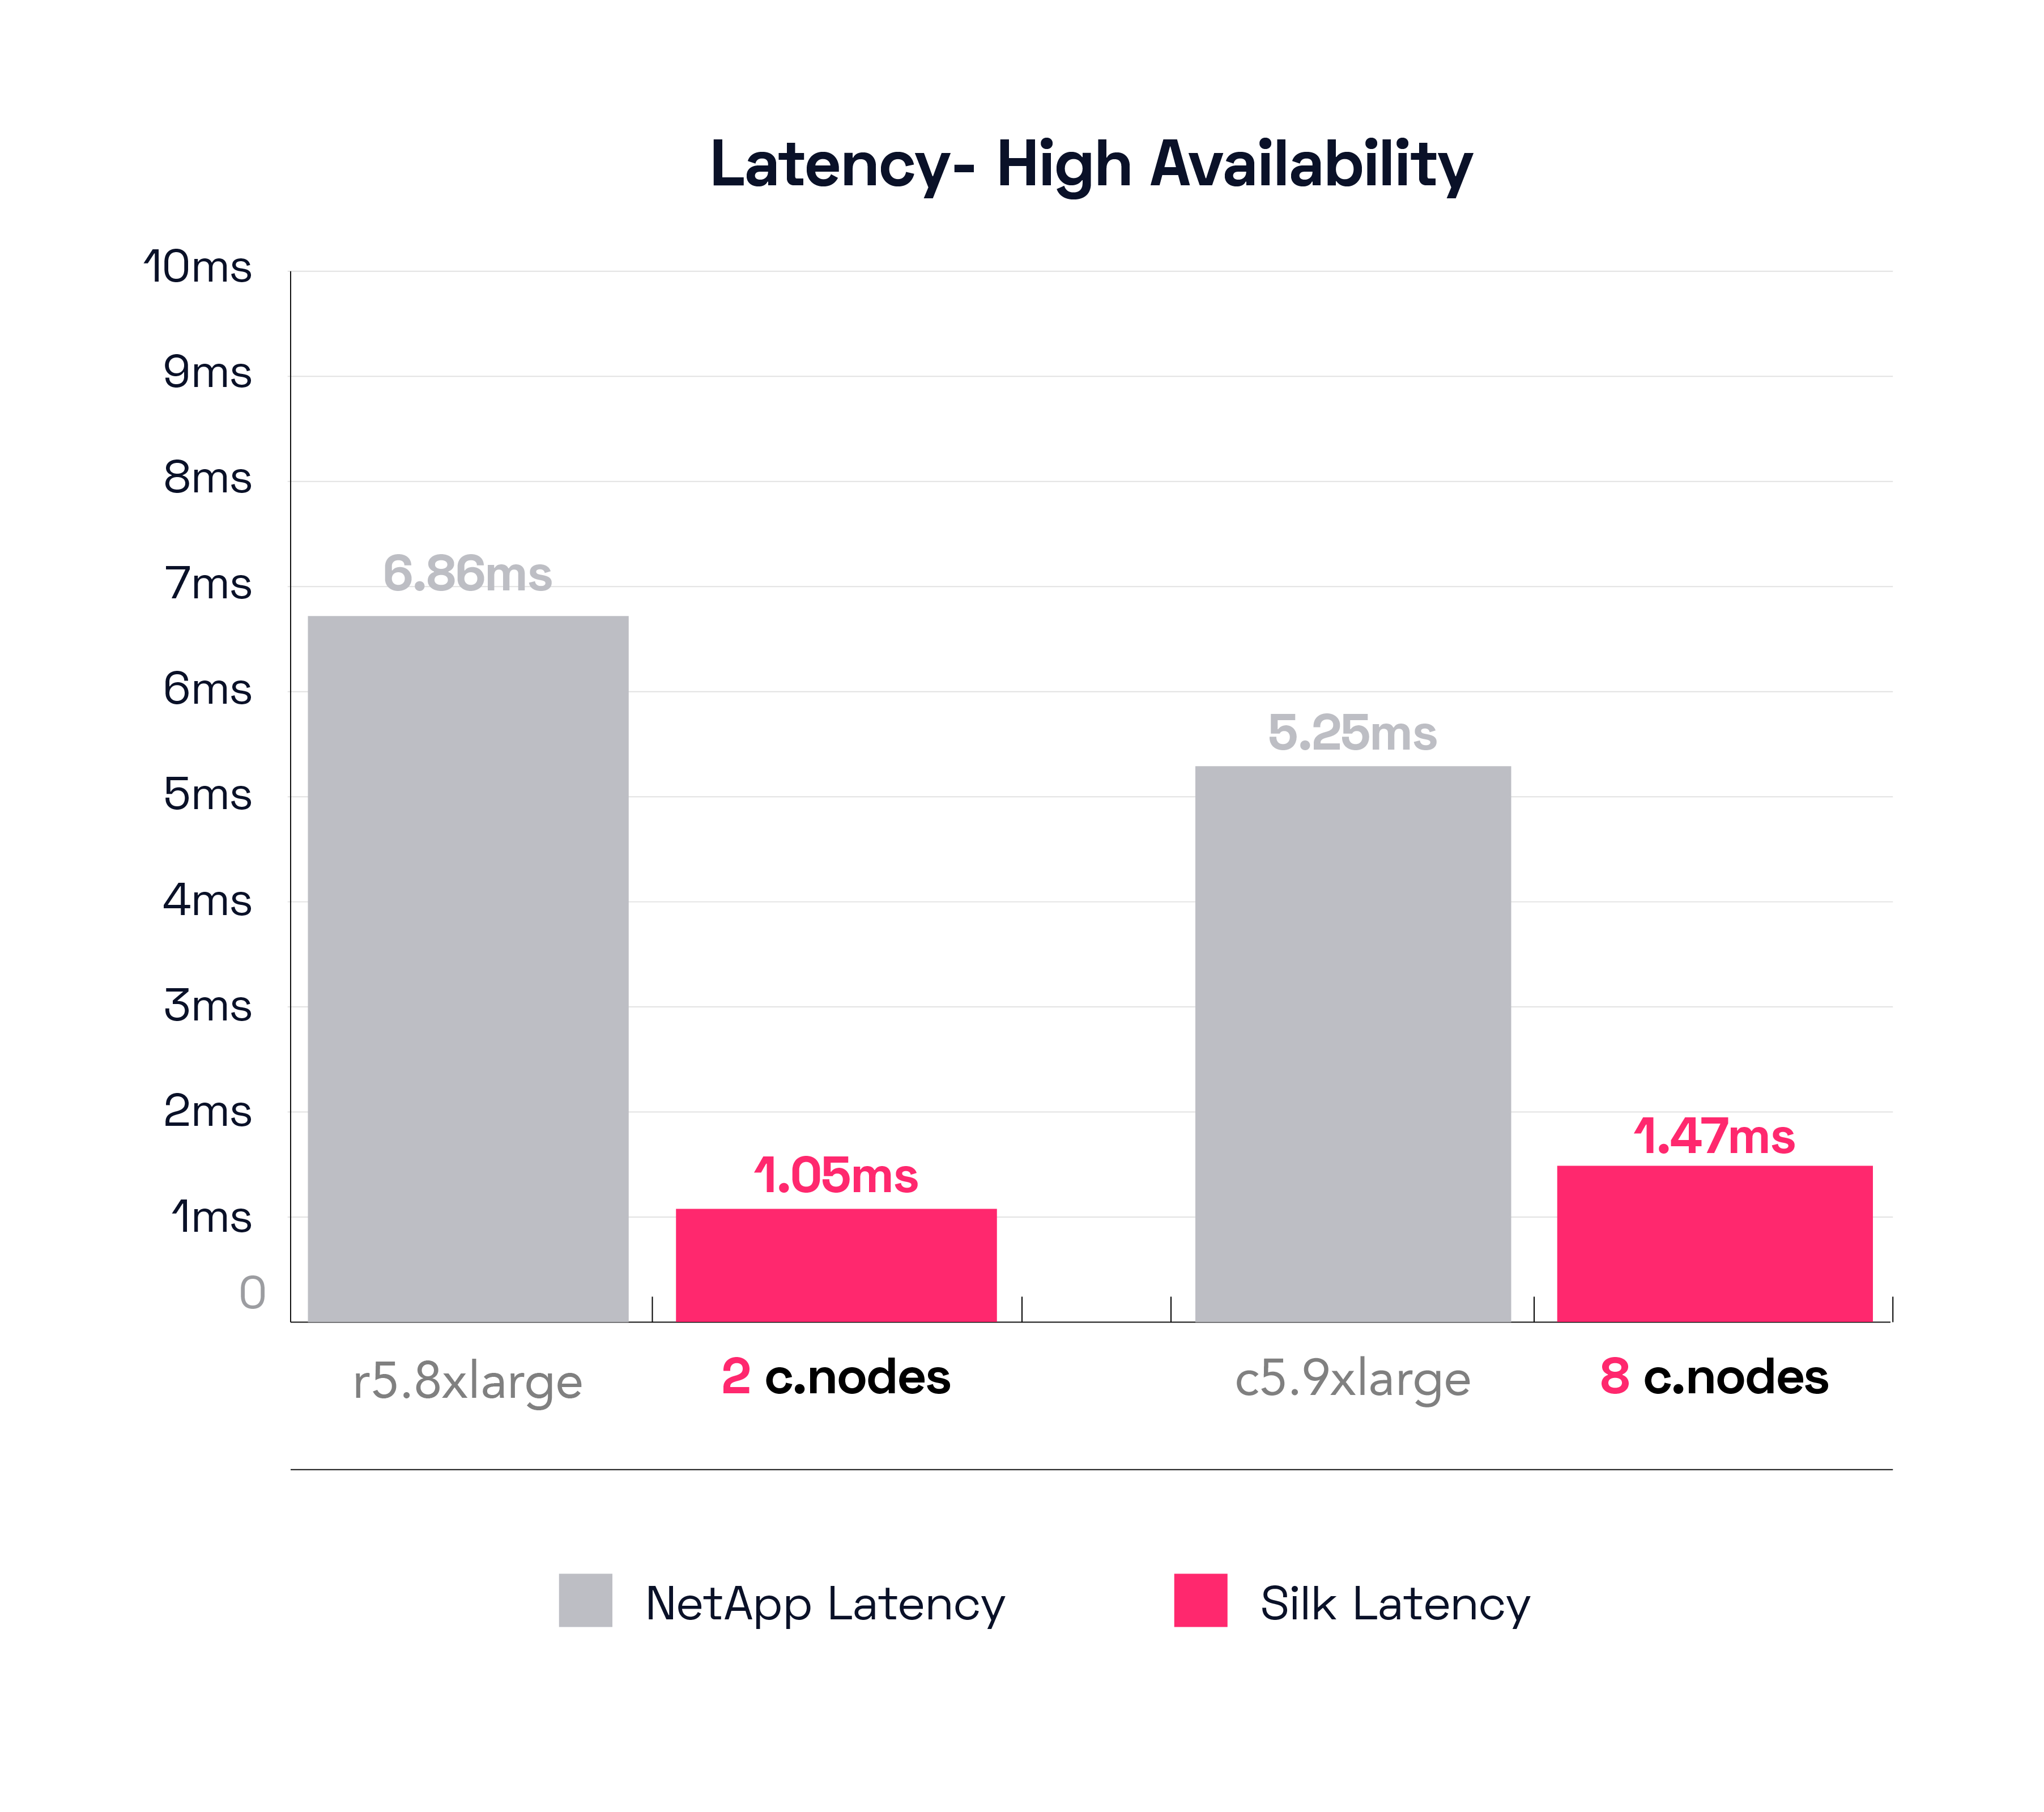
In our HA result graphs we see NetApp’s small r5.8xlarge engine producing 130118 IOPS at 6860 microseconds (6.8ms) latency, which is still 36% fewer IOPS than Silk’s 201891 from the 2 c.node configuration, and with ~7 times higher latency. Again—in our humble, expert opinion—7ms latency on small block transactions where latency is king is not super tasty. Let’s now look at NetApp’s best result, but this time it’s not the c5d.18xlarge, but rather the c5.9xlarge (frankly, we can’t explain why the c5d.18xlarge fell off the scaling pace for this test). The c5.9xlarge produces a NetApp best result of 166352 IOPS at 5.2ms, which is barely an improvement (22%) over the smallest config! Clearly, adding write elements into the workload profiles with sync-mirror enabled has a major impact on all IO operations. Looking at their results, basically *every* config is about the same, ranging from 130K to 160K IO with latencies from 5-6ms. This is another statistically significant result.

Let’s quickly review the big Silk data pod results—663,618 IOPS at 1.4ms latency, 400% more IOPS at ~1/4ththe latency of the NetApp! These crazy good results are enabled by the patented scalable architecture of the Silk platform (dozens of patent families), which can deliver just the right amount of performance by adding or removing controllers as needed to achieve the desired results. Silk does this with rich data services enabled, high availability always on, instantaneous zero-footprint clones and replication services running and can even provide this amount of performance from a single volume or from hundreds, accommodating whatever configuration your databases need.
OK that’s all for this entry. As mentioned before, our next entries will continue to test heavier, more complex, and actual real-world workloads that showcase what our platform can really enable for your most demanding tier 1 mission critical databases and customer facing applications. We opine that the Silk shared data platform does things that no other data platform can do—not Cloud native IaaS, not managed DBaaS, not NetApp, nor any other platform—provide rich data services and autonomous scalable high availability combined with much higher IO and throughput while delivering consistently dead flat-line low latency that supercharges even the heaviest application and database workloads!


