For the past few weeks, we’ve been comparing the performance and power of the Silk Platform vs NetApp Cloud Volumes ONTAP. Using NetApp’s own public test results, we have so far shown some dramatic differences in every aspect of the performance trinity: IOPS, Throughput, and Latency. We’ve done this with direct comparisons to NetApp’s tests and we’ve also run some additional testing of our own to showcase both the simple hero number results, as well as how Silk performs with some much more heavy-duty workloads. In the case of the former, Silk came out on top every time for higher performance at much lower latency, and in the case of the latter, Silk showed some incredible numbers under some of the most crushing workloads you would see from your real database applications.
As promised, since we’re done with the test comparisons, now we’re going to do something additional for you and run some tests using common workload profiles from the two databases with the biggest market share today, those being Oracle and Microsoft SQL Server, running on AWS, GCP and Azure.
The SQL Server and Oracle Tests
To start with, we profiled Oracle databases doing a variety of common tasks and then built a test profile to mirror the most common elements that we see. It’s quite complex, as you might imagine. This workload is about 80/20 random vs sequential access with mixed read and write block sizes ranging from 4K up to 1MB. I’ll include some ratio details next so you can understand the actual workload. The IO skew for reads was primarily 8K and 16K with some 128K (about 40%, 30% and 15% of the total reads, respectively) with the remainder spread out across the other block sizes. The writes were mostly comprised of 4K, 8K and 16K (about 25%, 35% and 20% of the total writes, respectively) with a decent amount of 32K-256K writes, and a smattering of writes above 256K. The total ratio of read vs write IOPS was about 83/17, which makes sense for an OLTP use case, 80/20 is fairly typical, which means that the overall IO percentage was (rounded to nearest integer) 35% 8K read, 25% 16K read, and 15% 128K reads, with the majority of writes being 8K size (about 8%), those IOs combined totaled 83% (35+25+15+8) of the total load. I won’t publish endless charts of all the exact details and numbers, as it’s not useful and quite boring, but I wanted to give you an idea of the complexity of the test.
That was the IOPS results. Now we’ll look briefly at throughput. The vast majority of throughput (over 80% total) was from the 128K to 1MB block sizes, for both reads and writes. This test was both a high IOPS and high Throughput test, with a huge variety of block sizes, read vs. write and random vs sequential access. Target latency was between 1-2ms for this test, which represents about an 80-90% saturation of the performance capacity of the Silk Data Pod. We were not attempting to get the absolute maximum performance here, what I am trying to showcase here is an example of how you might use Silk in the real world—supporting complex workloads at ~1ms latency (critical for transactional databases). Being an operator myself, I’m not interested in showing some ridiculous benchmark that pushes latency into the 5-10 (or greater!) range because that’s not viable for mission-critical workloads in the real world. OR—even worse, just show the big numbers and conveniently omit the latency (which NetApp did not do, to their credit, by the way).
We used vdbench as a load generator in this case, and this particular test was run on GCP using GCE and local disk IaaS elements to power the Silk software platform. As a side note, we see similar results on both AWS and on Azure—with some minor variations, a bit more IOPS here, more throughput there. IaaS VM capabilities and general cloud unpredictability contribute to the variations as well, but it’s usually not a large delta (<5% either way typically, which isn’t statistically significant for these kinds of tests).
Alright! Let’s look at the first test series that we detailed out above. Multiple VMs running Oracle database workloads, scaling up slowly from 2 to 8 c.nodes, and adding additional host initiators to keep the workload on the Silk Data Pod between 1 and 2ms latency (measured at the host with vdbench). I’ve shown the results broken out by 2 node increments for simplicity.
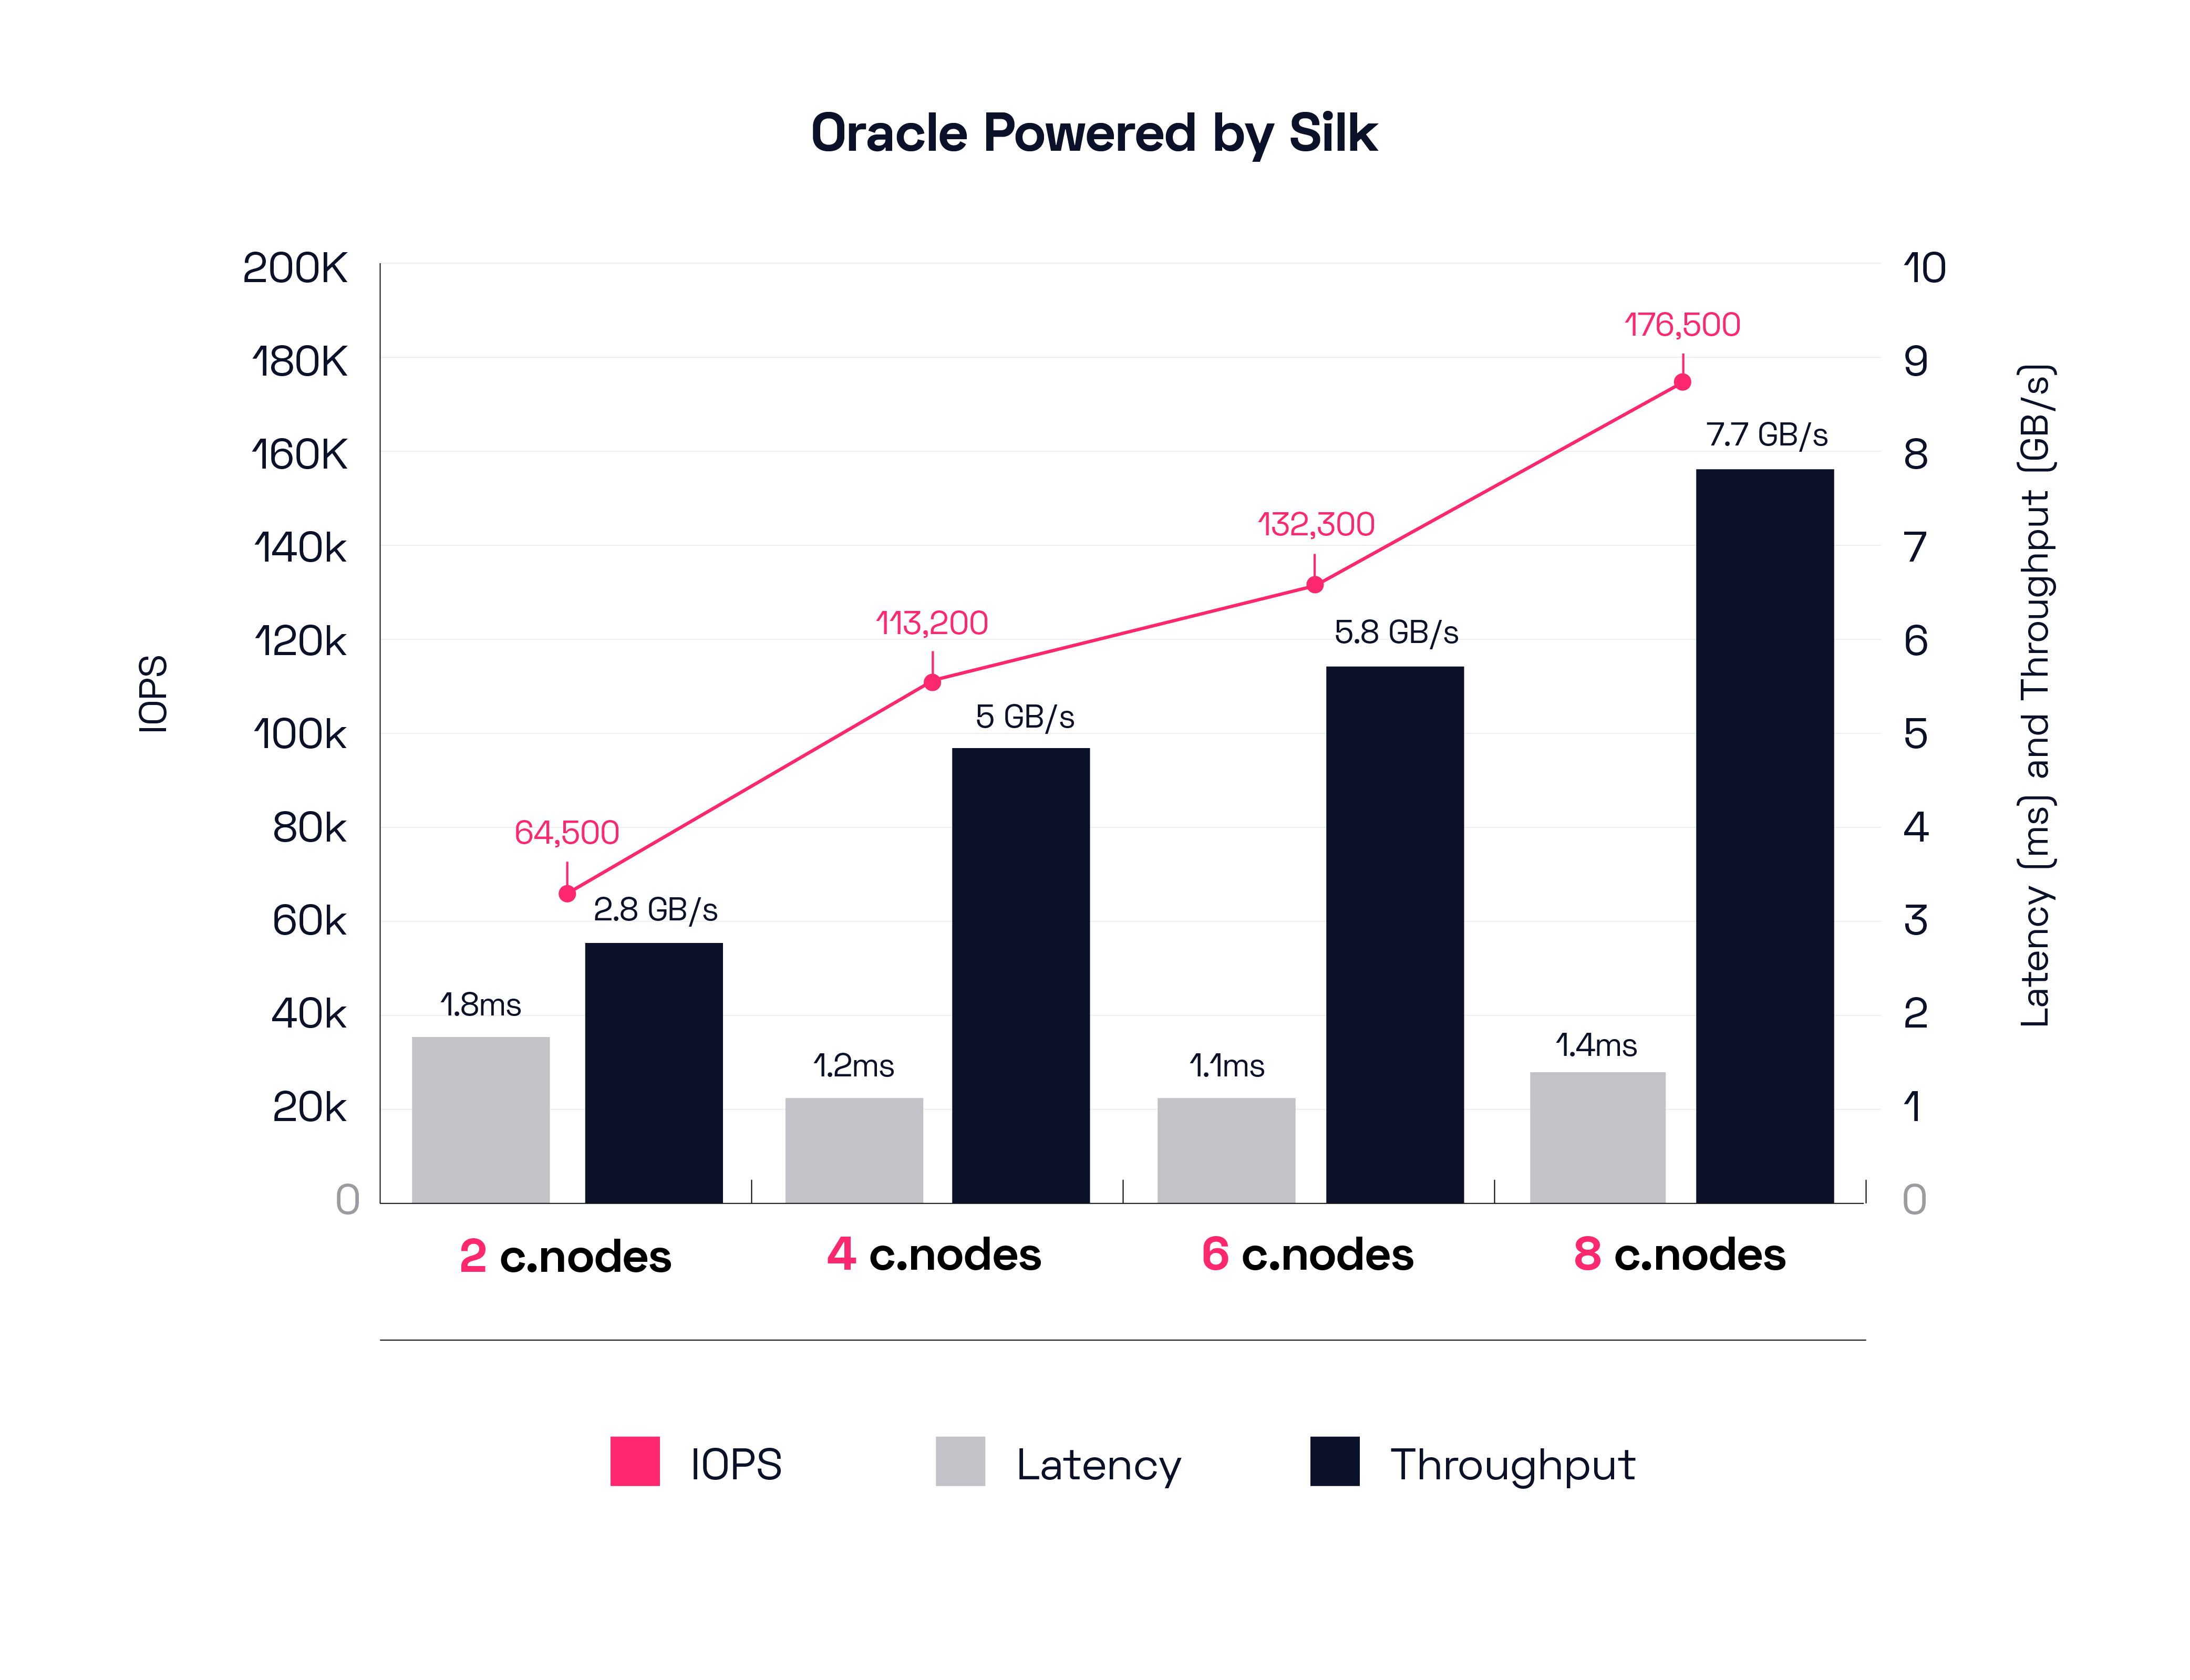
These results are really quite incredible on all three fronts: IOPS, throughput, and latency. With only 2 c.nodes (our smallest configuration) Silk is able to achieve almost 3GB of mixed workload throughput at <2ms host latency. With an 8-node configuration, Silk is pushing almost 8GB/s of throughput at a tiny 1.4ms host latency. Latency on the Silk platform itself is even lower than that (around 1ms). To move 176,000 IOPS of a full mix of small to very large block (up to 1MB blocks) with read and write going on driving almost 8GB/s of throughput between 8 different hosts is incredible. To be able to do it at only 1ms latency is impossible—for cloud native services. Silk is also doing this with rich data services enabled, thin provisioning, data reduction, snapshots, etc etc. I’ll also note that Silk can do this with one volume or a hundred—the number and size of volumes does not impact performance at all. Furthermore, from a single volume to a single host, Silk will easily max out the network bandwidth of that host, in the public cloud this is usually a 10, 25, 32 or 50Gbit network pipe, and Silk uses IP based iSCSI as a transport medium in the cloud today. Right now, the network is usually the bottleneck, not Silk. We expect that eventually greater bandwidth and NVMe/TCP support will allow for higher (and faster) throughput between hosts. As Silk already supports NVMe/TCP protocols we will just go along for the ride, getting higher throughputs and lower latencies as cloud infrastructures improve. Silk can also scale out as much as needed, beyond 8 nodes, for use cases that might require a single massive vertical IO stack such as we find in traditional architectures.
Let’s take a look at the SQL profiles now.
This workload is about 80/20 random vs sequential access with read and write block sizes ranging from 4K up to 512K. The skew for reads was primarily 8K and 64K (about 50%, and 30% of the total reads, respectively) with the remainder spread out across the other block sizes. Write IO was comprised primarily of 4K, 8K and 64K block (about 25%, 35% and 25% of the total writes, respectively).
The overall ratio of read vs write IOPS on this SQL workload is 68/32, there are a lot more 64K writes in this profile. The overall IO percentage was about 35% 8K read and 20% 64K read, with the majority of writes being 8K and 64K (~10% each). These IOs combined totaled 75% of the full load (35+20+10+10).
That said, the vast majority of throughput (over 35% total) was from the 64K reads and writes, with the rest coming from big 512K reads (SQL read ahead scans probably). This test was also both a high IOPS and high throughput test, with a huge variety of block sizes, read vs. write and random vs sequential access. This is an exceptionally heavy and complex workload for any platform.
We started again with just 2 c.nodes and a few hosts running the profile, then we scaled out from there, adding nodes one at a time from two up to eight and additional hosts for load. I’ve also shown the results broken out by 2 node increments for simplicity. We’re using the same platform and test harness as before, running on GCP using GCE and local disk IaaS elements to power the Silk software platform. As we mentioned before, Silk gets similar results running on AWS and Azure, with some variances—each cloud provider does some things a bit better or worse than others, and the quality of the host compute is a bit variable, and of course, it’s not always possible to know exactly what else might be running while we’re doing our thing. We ran enough iterations to know these are commonly achievable results on any of the three clouds, none of these results are outliers.
Let’s look at the SQL profile results.
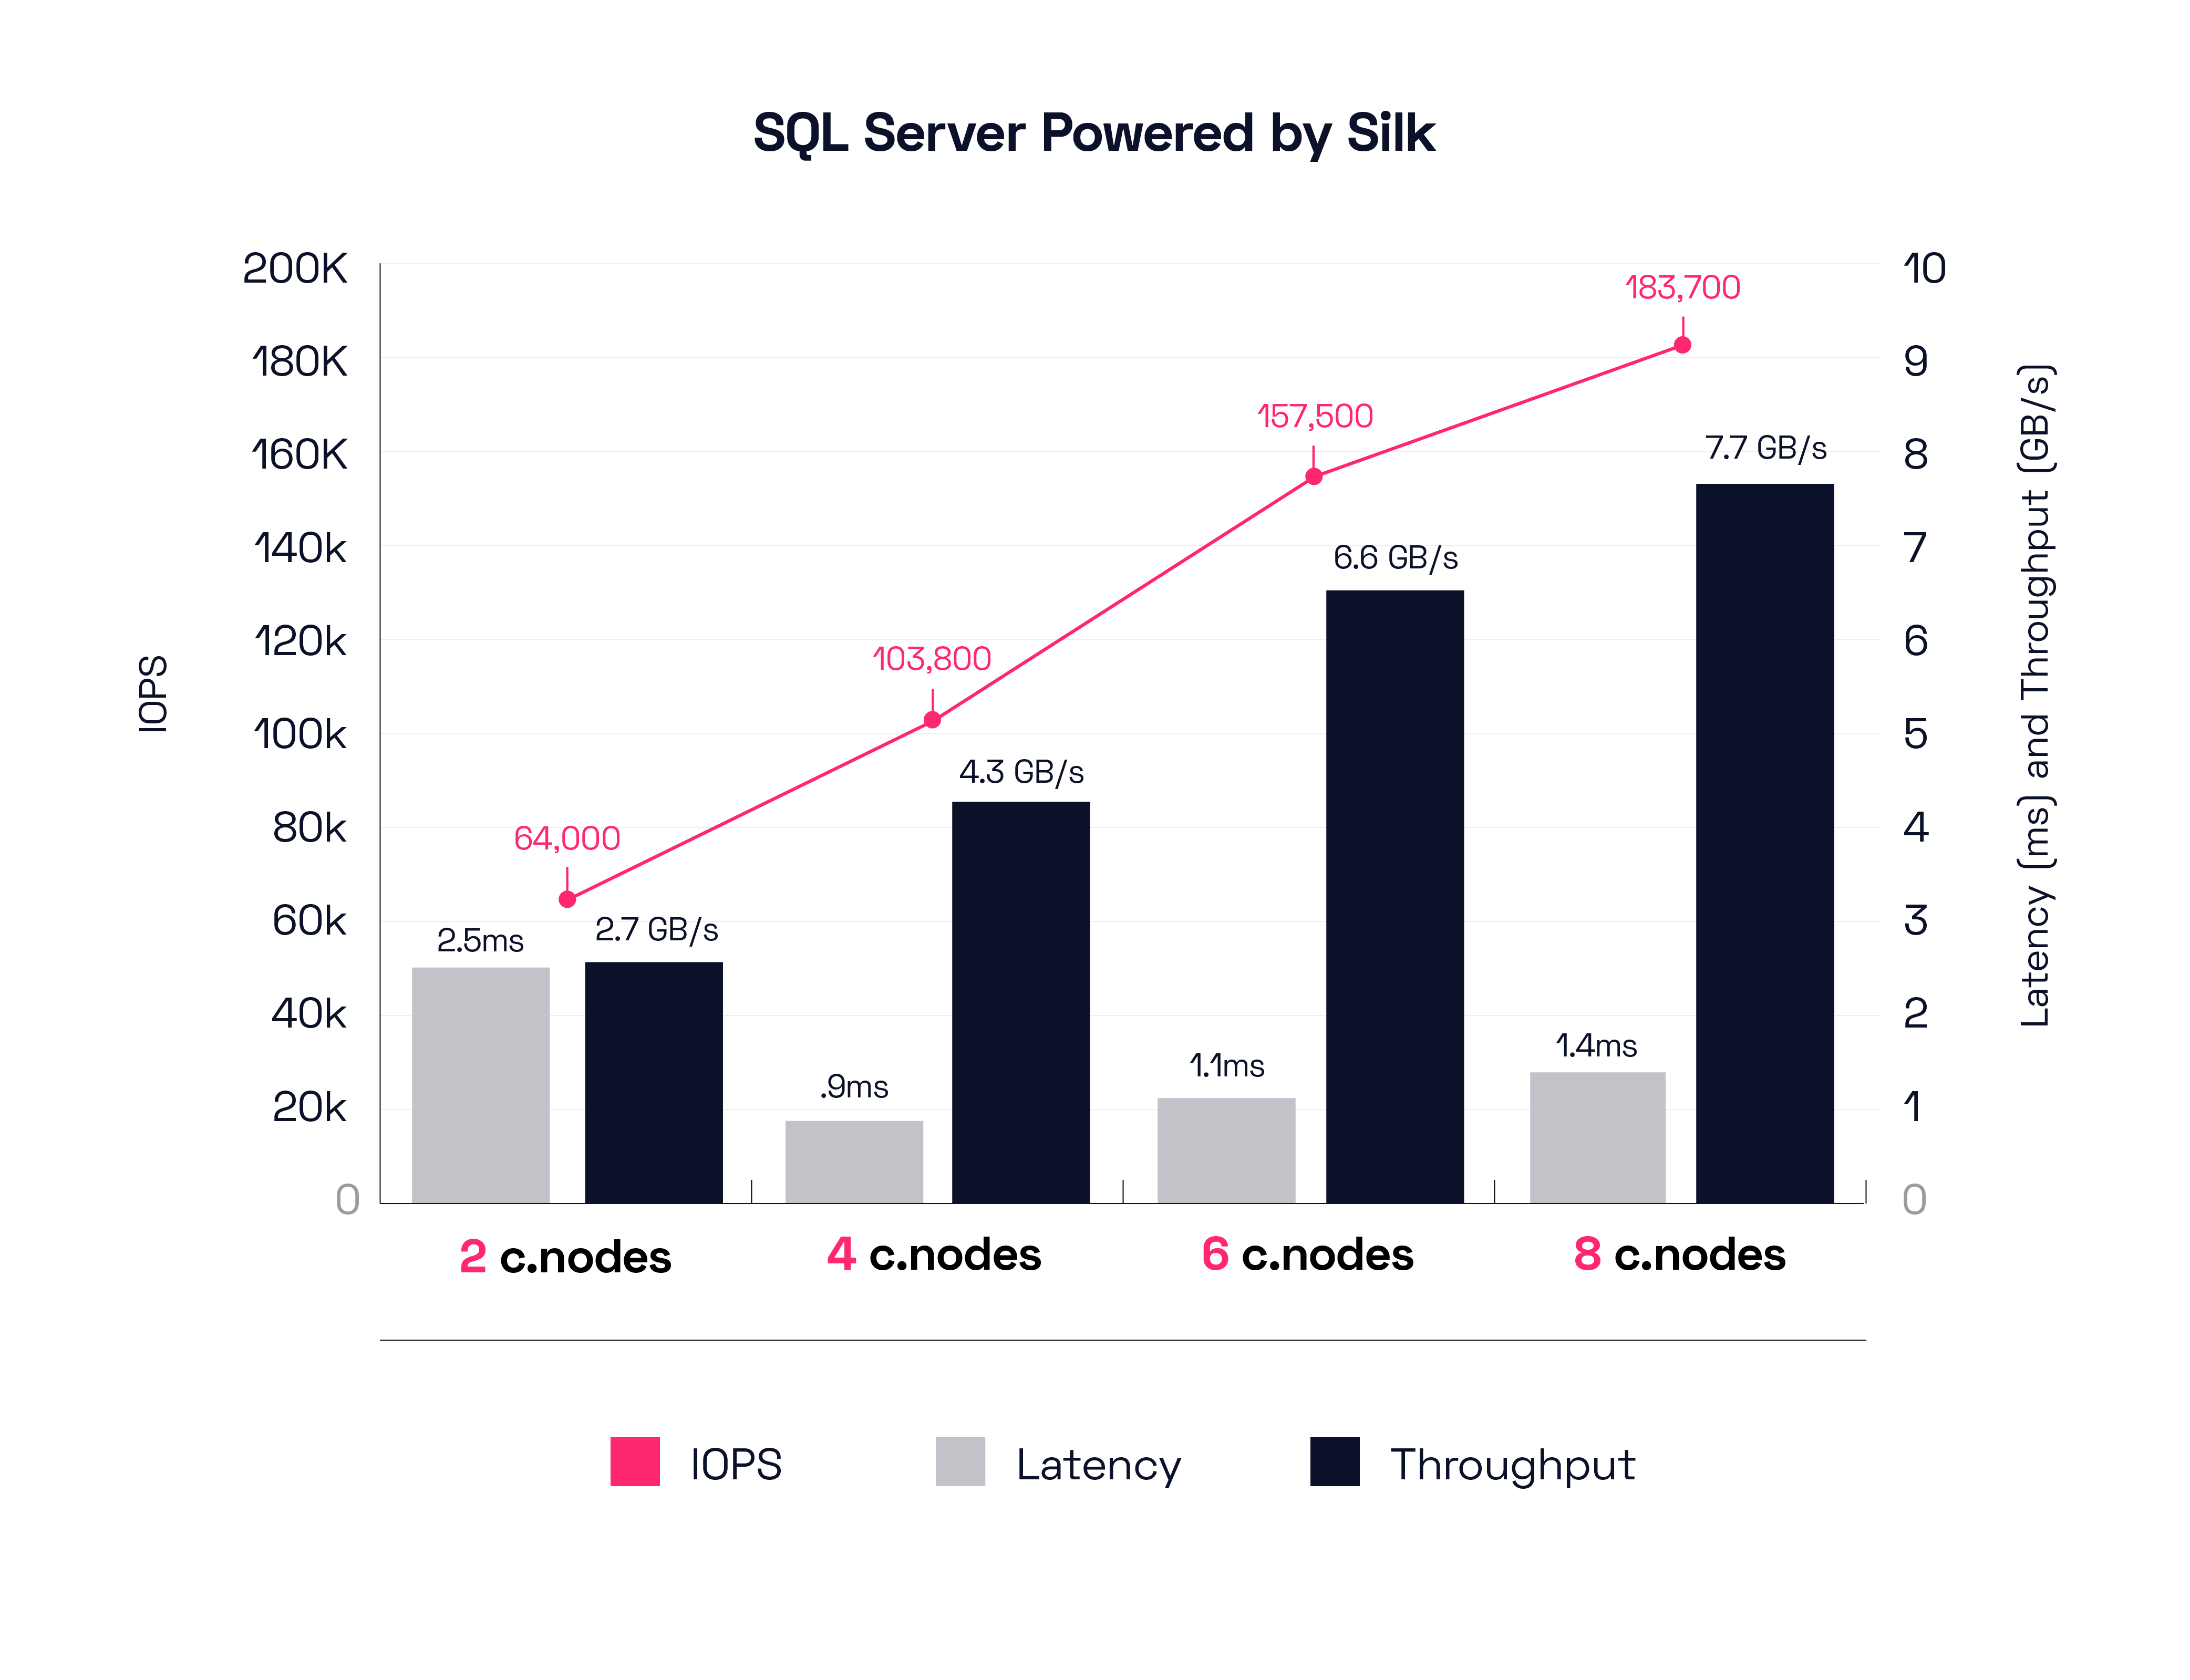
A big difference from the Oracle results—we see a lot more IOPS to get the same throughput as SQL had smaller blocks for their big IO requests than Oracle did. Overall, the scaling is about the same. Starting with 2 nodes we are able to drive 2.7GB/s of mixed block workload at around 2.5ms, scaling up to 8 nodes pushing almost 8GB/s of throughput from 183,000 IOPS at a lovely 1.4ms host latency. We challenge anyone to get these kinds of results running in the cloud, with rich data services turned on and the ability to add and remove performance capacity with a mouse click (It takes about 10 minutes to add another node in or remove one out from the active-active group). The great thing about dynamic scale in/out is you can architect for your average workloads, while still easily supporting peak demand at any time. When peak is over, you can turn those resources off, or move them somewhere else.
Now, what do these results mean? What is the value to you and your business operations?
They mean that you can move your mission-critical Oracle and MS SQL database workloads straight into the cloud with a simple lift and shift without refactoring, modernizing, or porting to a different database. Keep your existing databases, business logic and application operations! Don’t spend years and millions doing risky rewrites or expensive ports that won’t even really work!
You can ALSO then move all the app servers that leverage those databases as well, without making any changes. It will all run as good (frankly, probably FASTER) than it ran on-prem, and you have just accelerated your cloud migration by 2 years or more, all without taking any significant risks. You will be given a crown and a purple cape and be treated as the genius royal architect that you are, and feted with the finest meats and cheeses, and perhaps they will even put a giant ring on your finger. You deserve it. Now, let’s look even further at Silk’s capabilities.
Oracle Deep Diving – TCP-C, TPM and NOPM with SLOB and HammerDB
We have been doing a good bit of other testing as well using some standard database test harnesses, since many of you are familiar with these tools more than just block IO tests, I thought it might be nice to show you some of the things we’ve done recently in the last month or two.
To start with, let’s look at a few SLOB (Silly Little Oracle Benchmark) results running on Azure with a “regular” sized Silk Data Pod—that is, only 3 nodes, which is a decent starting size providing excellent performance with some High Availability coverage (in case the cloud decides to drop/reboot a node you will still have two nodes up while Silk’s autonomous recovery capabilities builds and inserts a new node back into the pod for you automatically).
Here we’ve run an 80/20 R/W mix with 8K IO Request size (standard OLTP style).
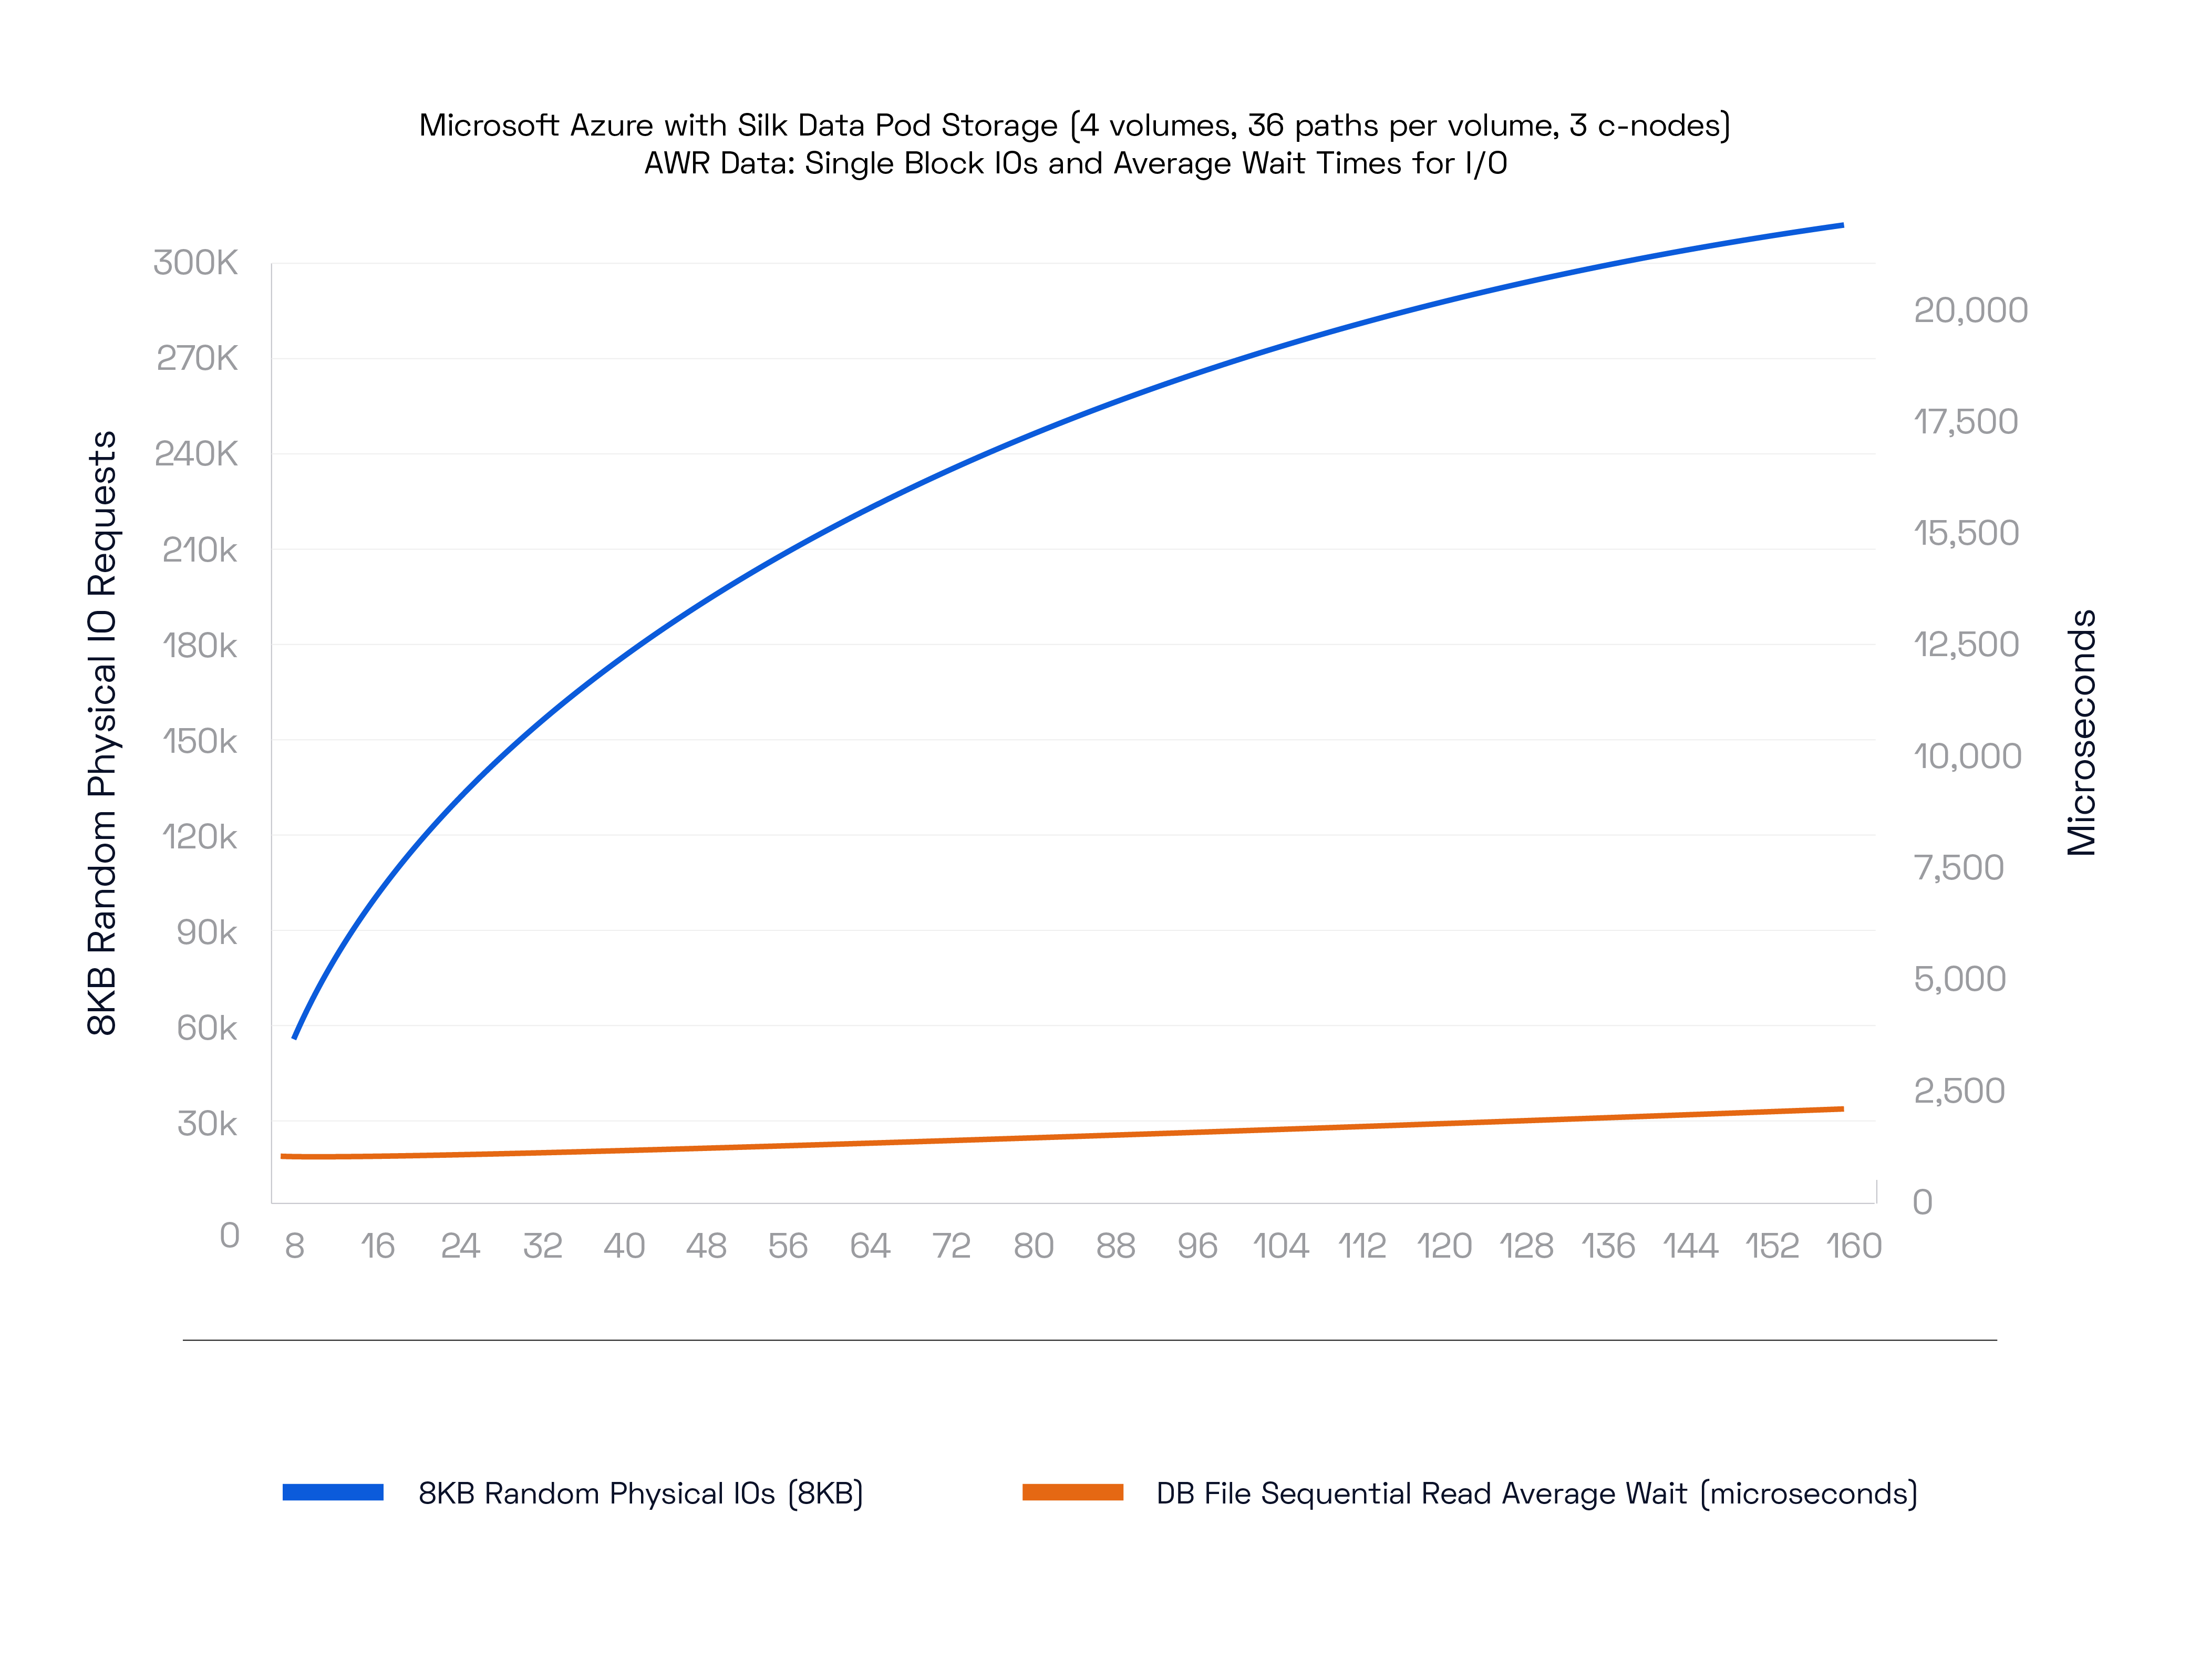
Silk is able to drive over 300,000 IO requests at 2ms latency! This is outstanding stuff and is about 50x better than cloud native premium SSDs.
On this next test run we tested read throughput with 8K reads on the same platform.
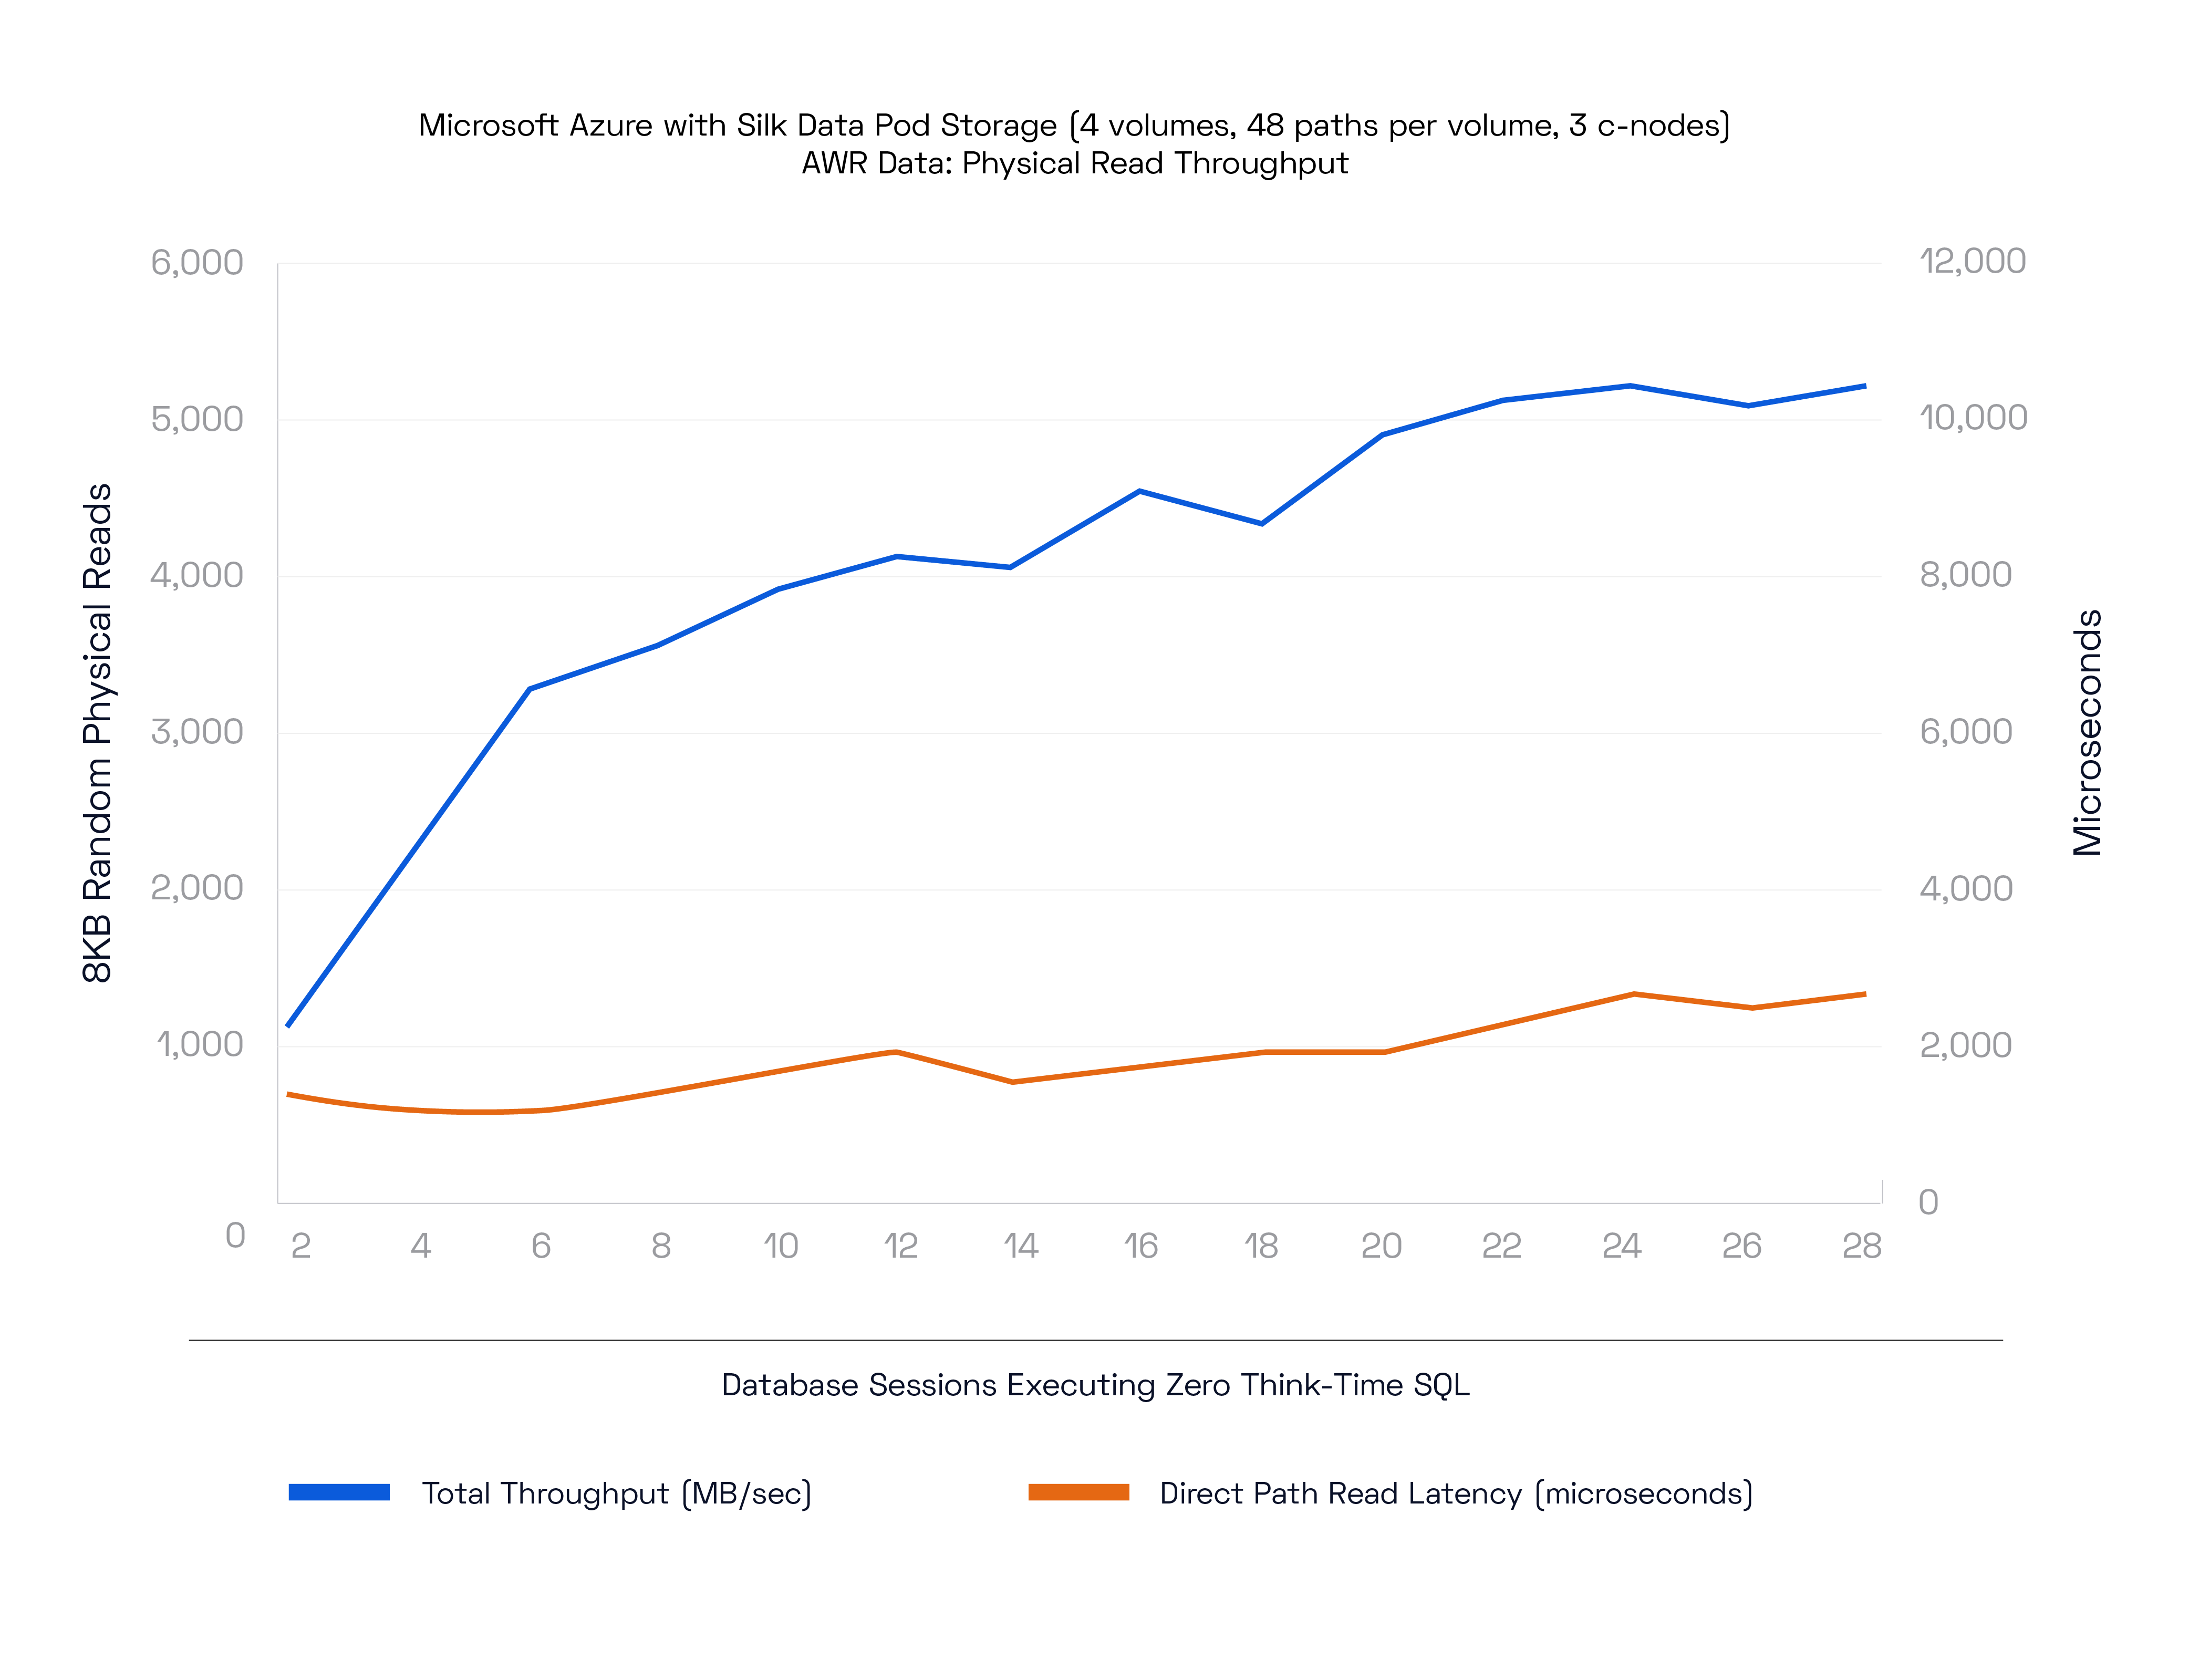
These results are also amazing: 5GB/s of throughput at 2ms latency. With only 3 nodes online as well! These are breakthrough results for big Oracle and SQL databases that require far more throughput than is available from SSDs, without having to overprovision and aggregate dozens of SSDs per instance which brings a huge cost along with it.
It is true that today a huge problem with cloud IaaS is the requirement to massively overprovision compute or storage in order to get enough IO. Gartner estimates 35% of cloud resources are straight waste—completely unutilized resources. The amount of underutilized resources in cloud IaaS are probably double that again, due to the incredibly inefficient manner that cloud resources are tied to each other.
Let’s look at some more tests, this time using HammerDB to generate TPC-C like results for Transactions Per Minute and New Orders Per Minute, on both an Oracle and an MS SQL database.
We took an on-prem all-flash array (not ours—vendor to remain nameless) and used that for the baseline performance. We then ran HammerDB with TPM and NOPM tests against it to generate the baseline. Then we replaced the On-Prem AFA with Azure P30, P40, P50 and P60 disks. We also ran these tests against an Azure managed database instance (for SQL, not Oracle), and finally we ran these same tests on a 3 node Silk Data Pod. I must say, a great time was had by all.
Let’s look at the results, starting with Oracle:
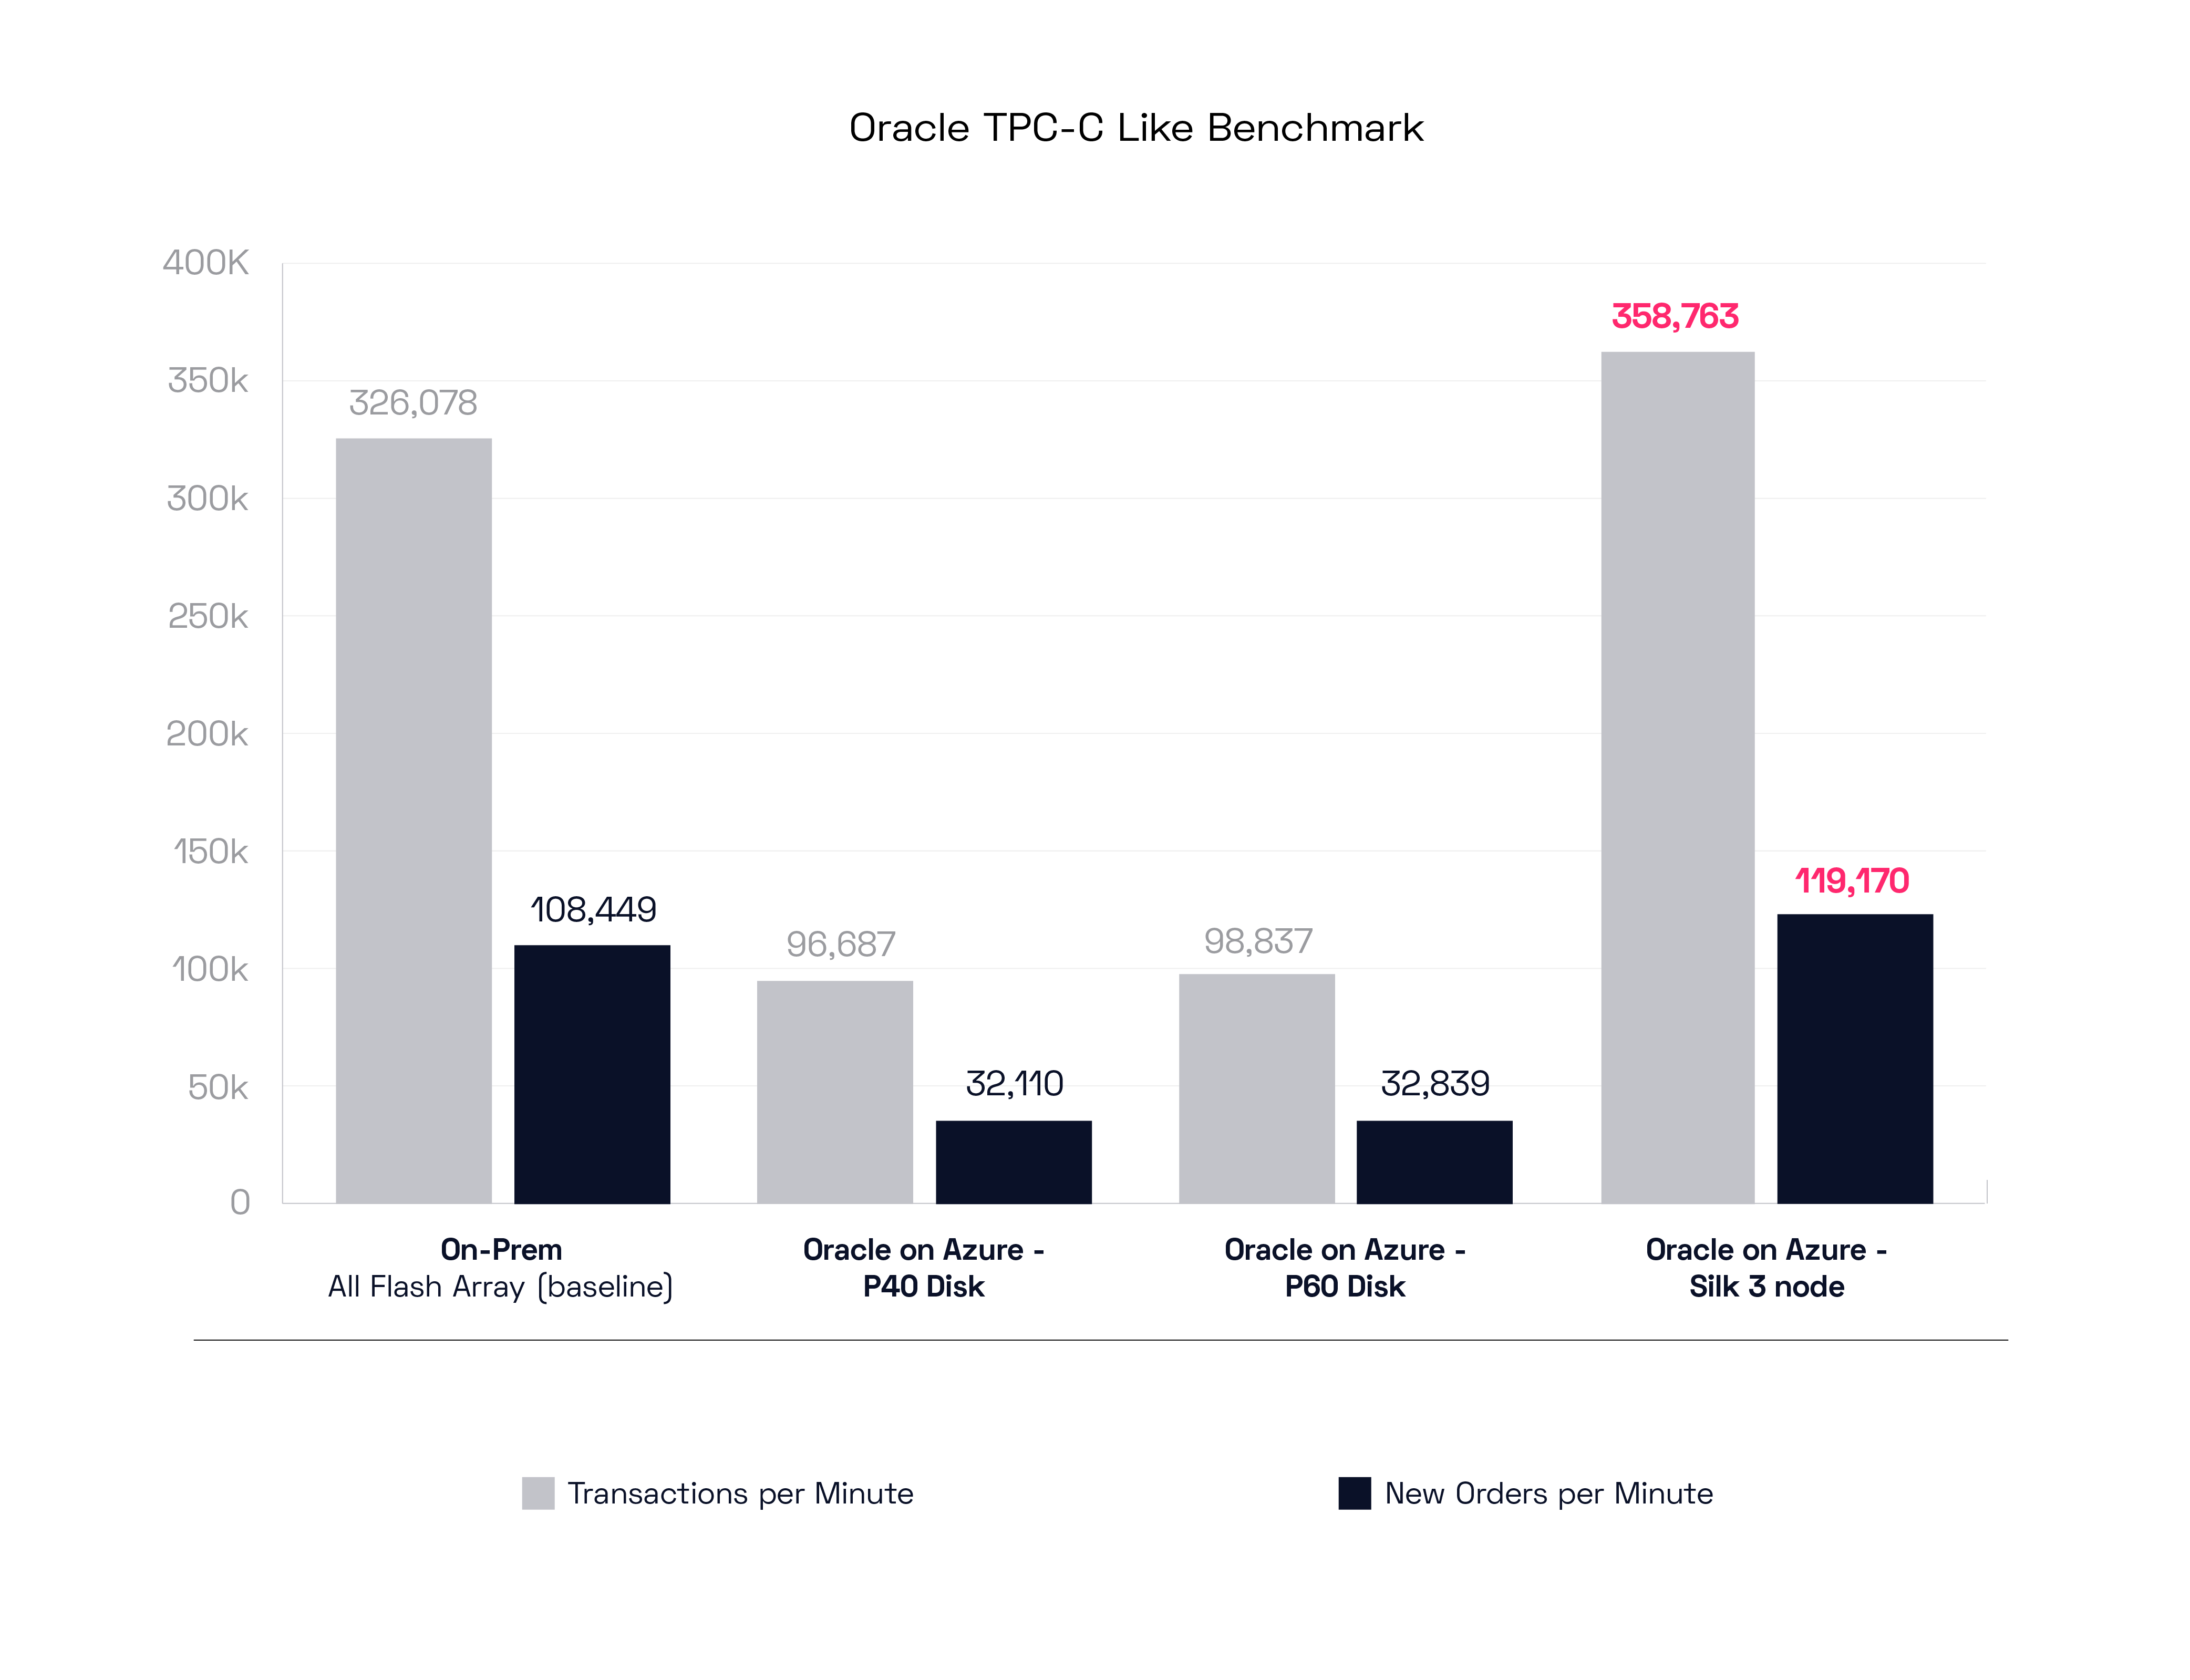
The on-prem AFA set a decent benchmark of 326k Transactions per Minute with 108k New Orders per Minute. The Azure IaaS disks both did about 30% of that total, although at much higher latency (which isn’t shown here, sadly!). The main data point, and the star of our show, is on the right side of the graph, where the HammerDB test shows that (with only 3 c.nodes) the Silk Platform was able to EXCEED the performance of the all flash on-prem array by 10%, which is insane!
So, for those of you looking for on-prem like performance without a refactor, and you just really need to move your Oracle into the cloud, and quickly—Silk can enable that for you, really.
Let’s look at the MS SQL test results now.
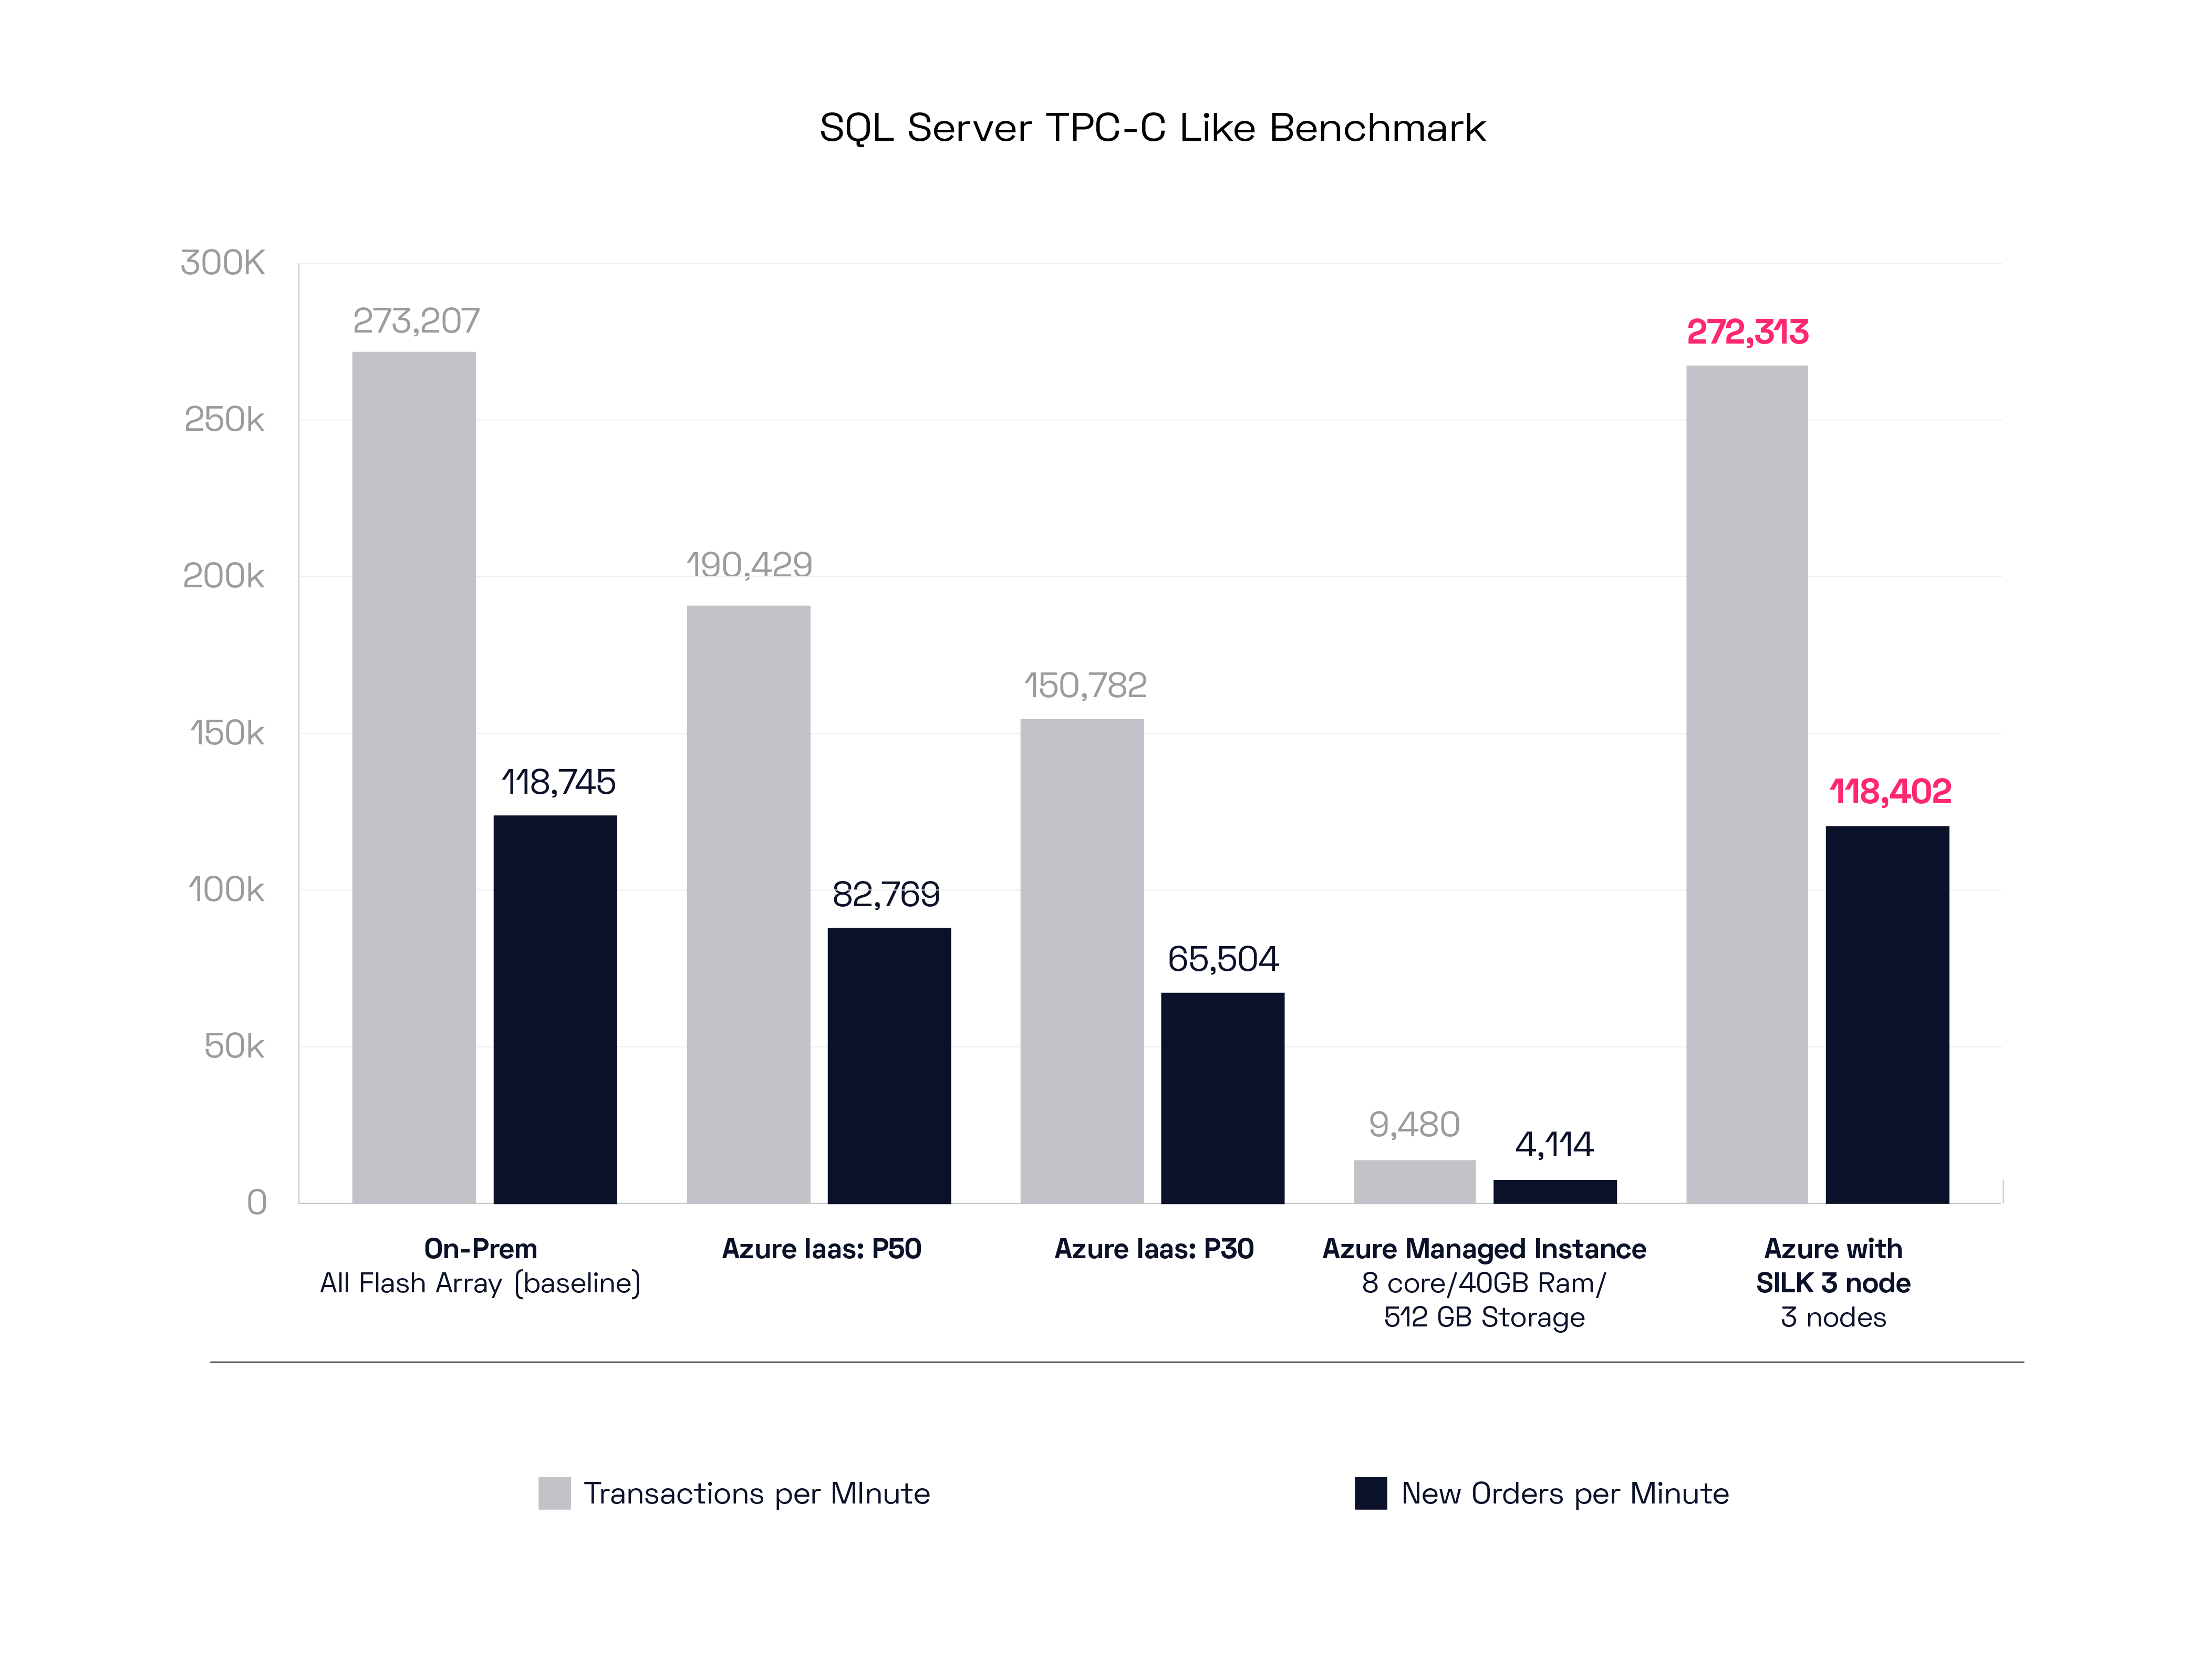
This is the same test as before, except with MS SQL, and we’re using P30 and P50 disks. We also additionally included a comparison to a small Azure managed database instance, to see what we might expect performance wise from the managed database services option. The on-prem results were a bit slower than with Oracle, but the Azure results were much higher, pretty respectable really. The Azure managed instance test result was… uh… very small. I’m sure you can bump that performance up for the right price. The Silk 3 node instance in this case matched exactly the on-prem result, which is still quite spectacular, as we can extend that performance easily by just instantiating more c.nodes as needed.
Dynamic automated software-based scale out is extremely powerful! To show you how powerful it is, we ran this test again with an 8 c.node config. Now watch this:
Silk managed to crank out over 1 million Transactions per Minute with this config! For those of you who really need to pump up the volume: Silk is your answer.
Cloud Native Comparisons
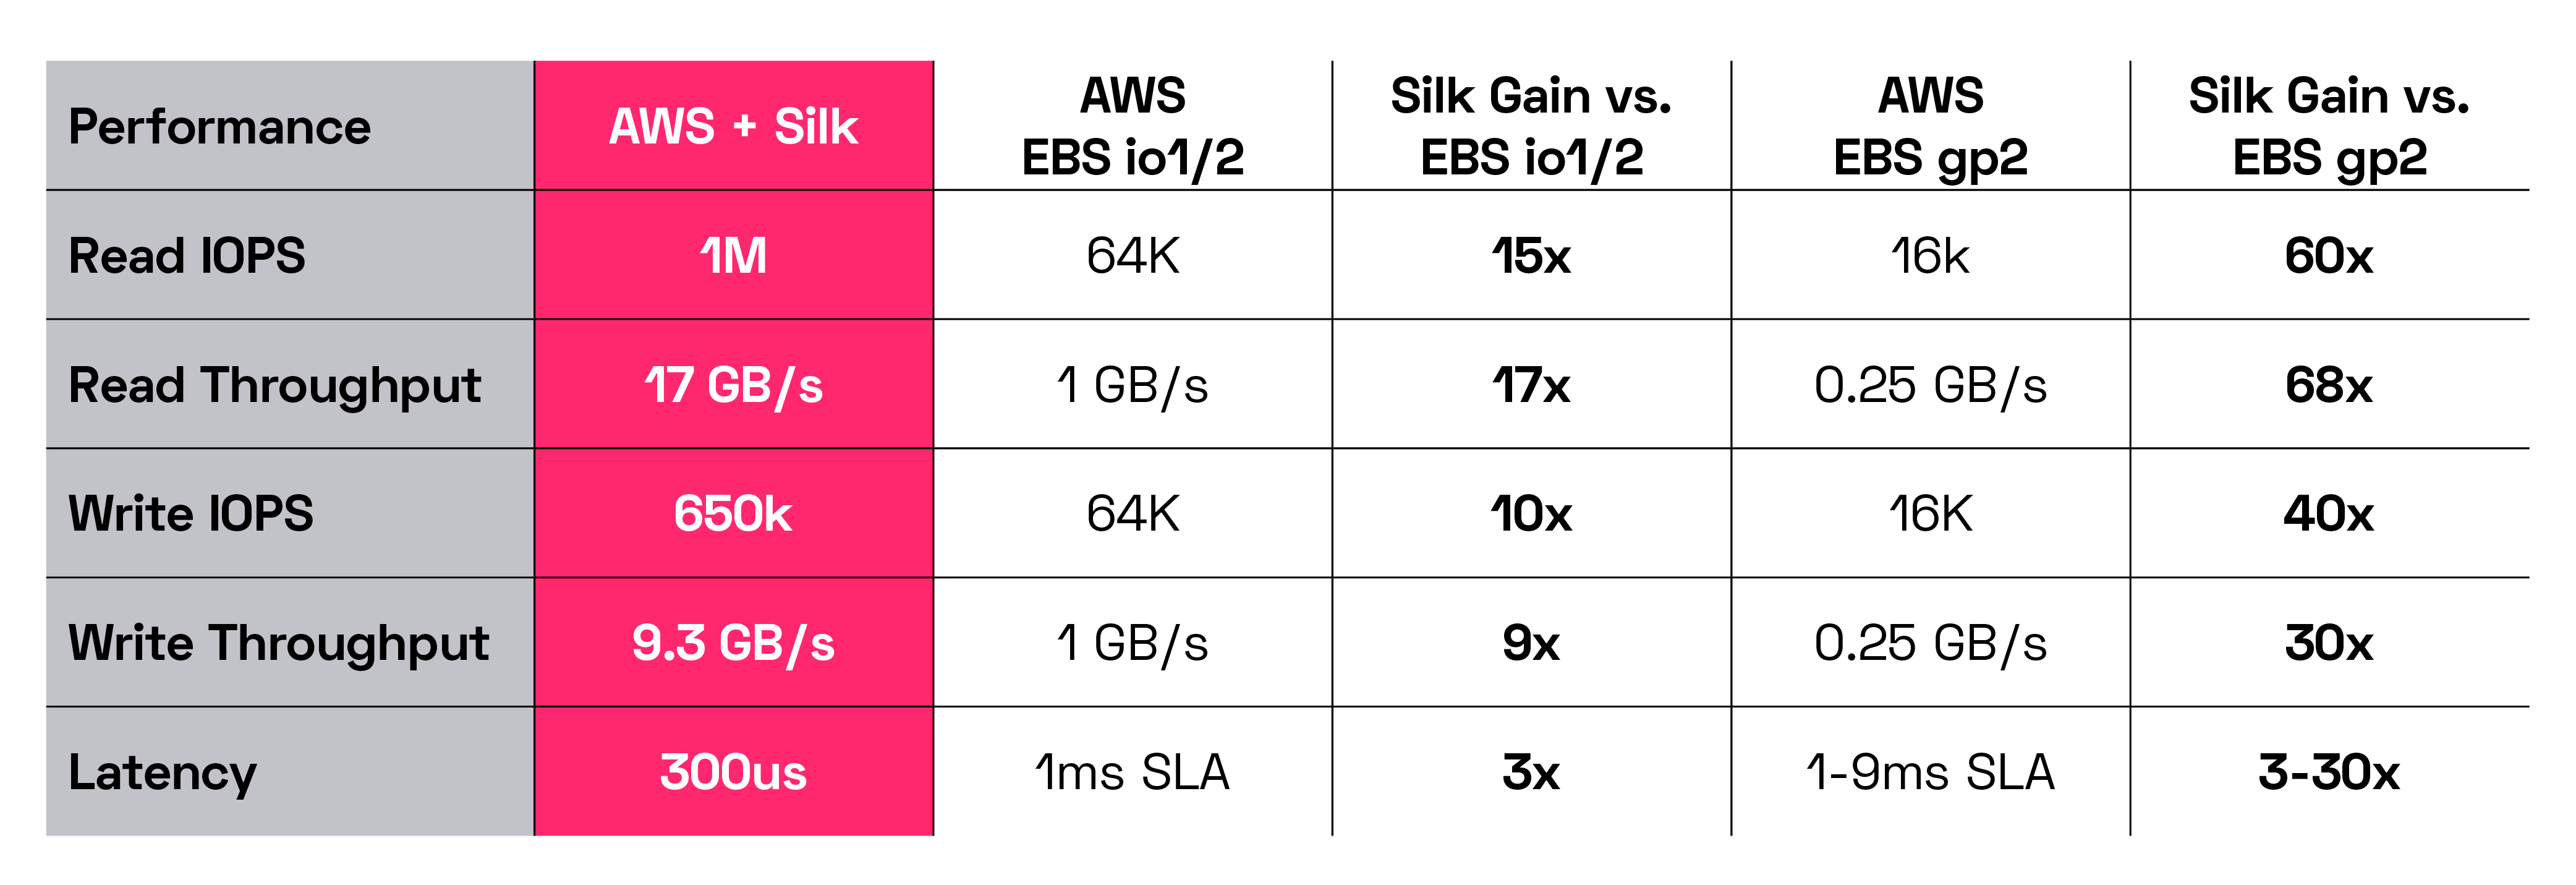
Alright, so we’ve seen how powerful Silk is with standard database benchmarks running against on-prem dedicated AFA hardware and versus cloud native IaaS options. Let’s take a deeper look at how Silk compares to the three major cloud providers IaaS data offerings. This is to illustrate just how massive the differences are between the cloud native portfolio and what Silk can provide. These values are the stated performance numbers taken from the cloud providers websites—we aren’t using our own numbers from testing their stuff, we just did a copy/paste of what their stated rated maximums are. The Silk numbers are our own real results from live testing of a Silk 8 node platform on each of the cloud providers. We’re using their theoretical maximums vs our actual achieved best results—a bit of a disadvantage to Silk but we’ll be OK.
First a comparison to Amazon Web Services:
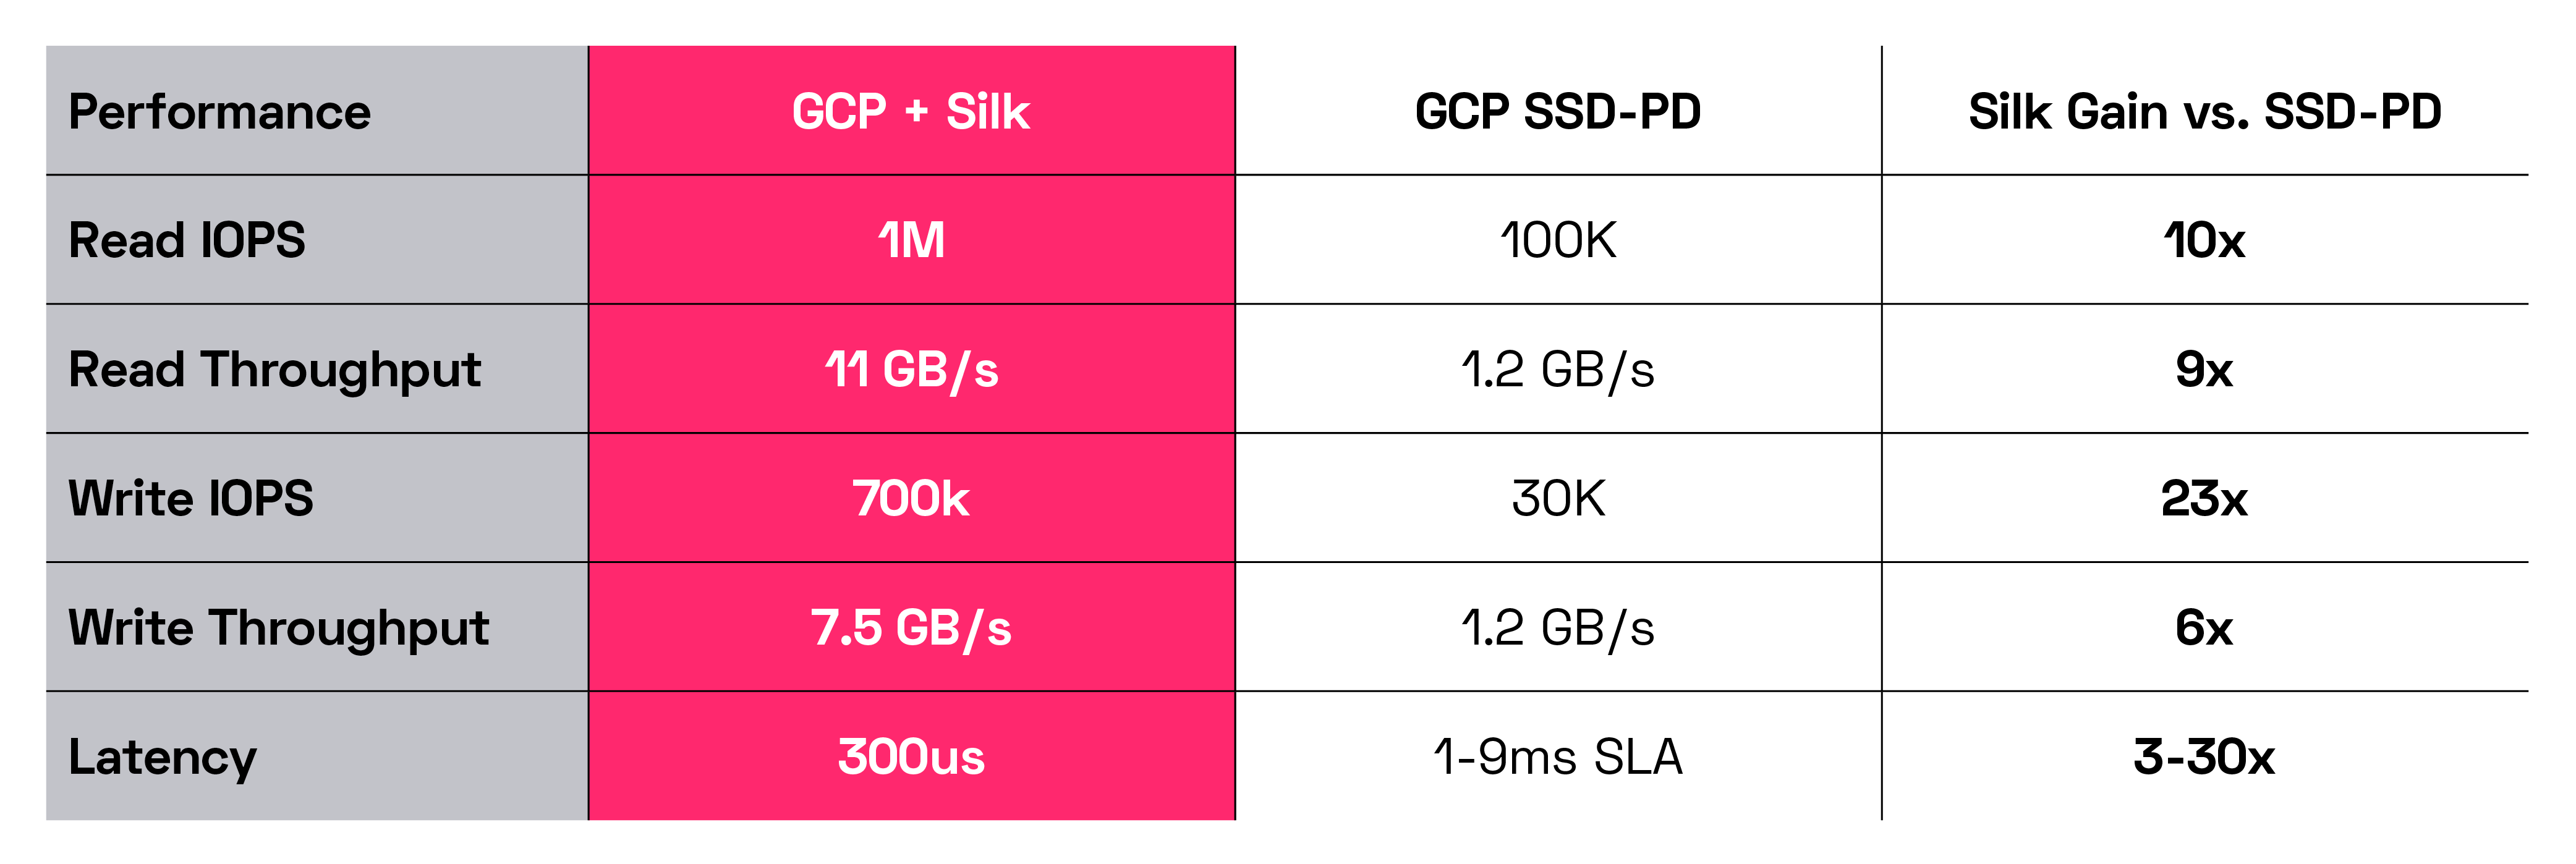
Next, Google Cloud Platform
And lastly, Microsoft Azure:
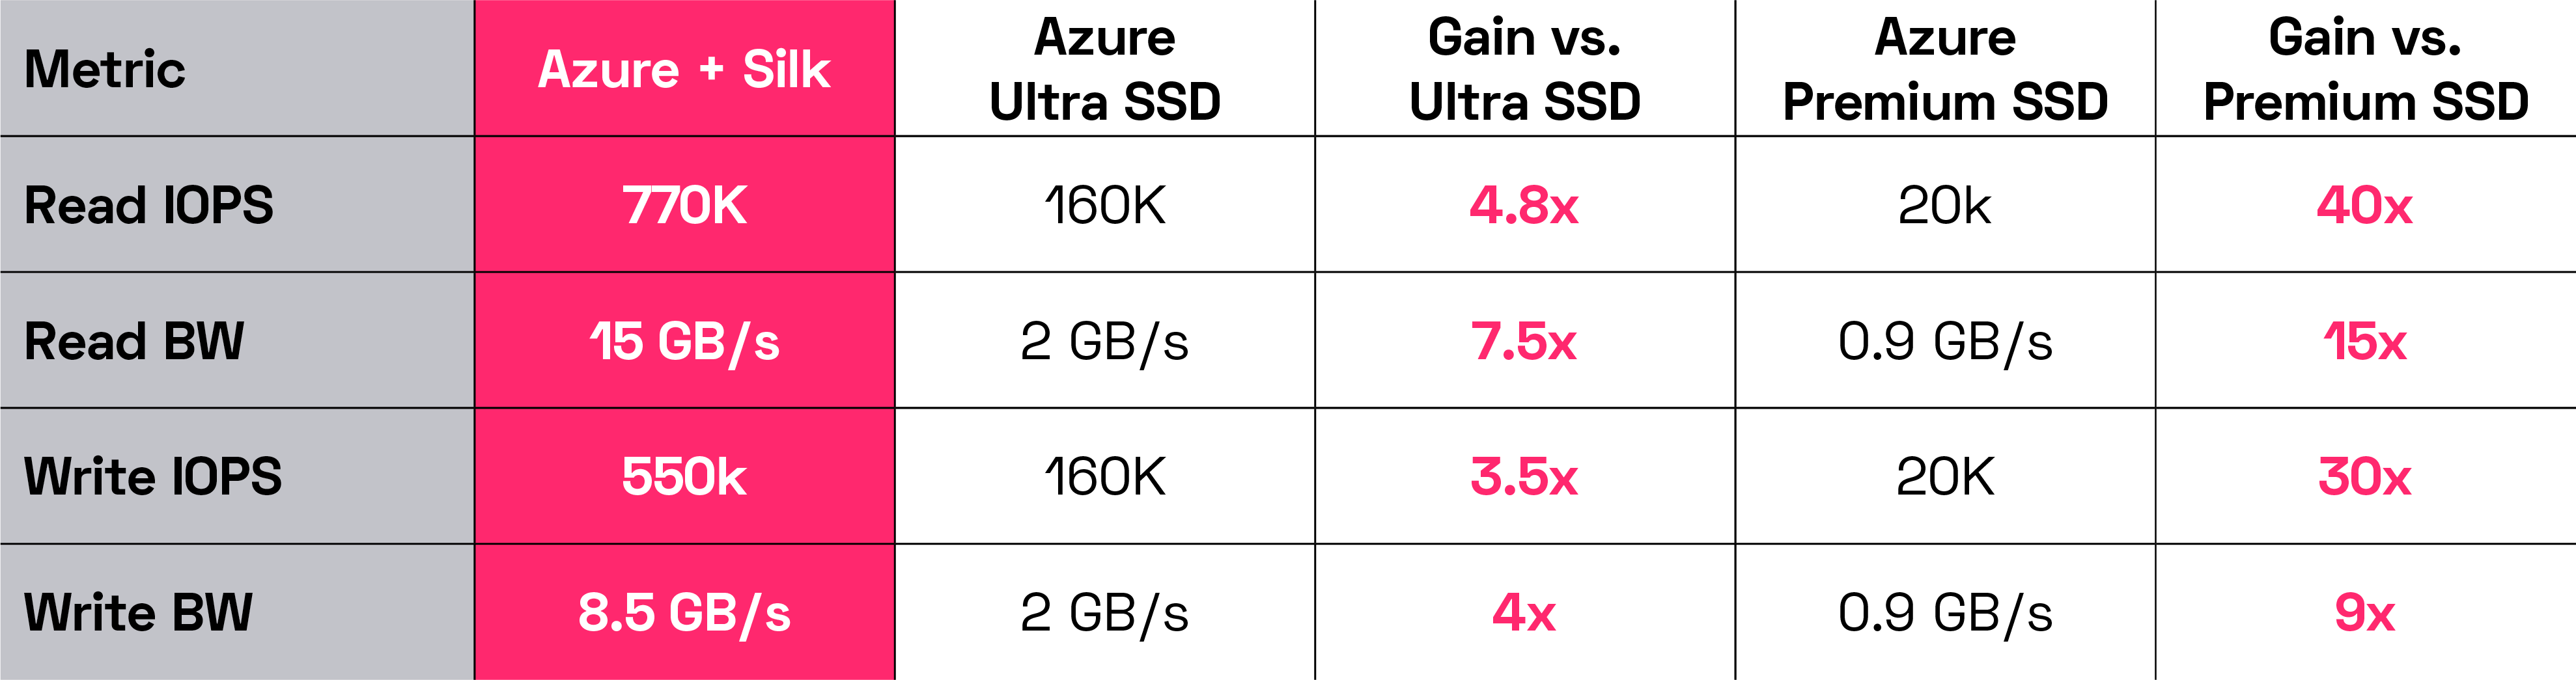
Silk’s performance is scalable of course, up to these maximums. To get more performance you can just add another node, non-disruptively. It takes about 10 minutes or so to instantiate it. It’s quite simple to do.
When we are talking about performance, it’s a highly dynamic mix between a really large number of variables, from the host to the network to the application to the data platform–beyond just the simple mix of IO request profiles. Most vendor numbers that are published tout theoretical rated maximums that are rarely achievable in the real world, or if they are achieved, other critical elements suffer (for example, maybe you can push a large amount of throughput, but your latency goes up to 700ms—something we see in the cloud all the time).
So, it’s often confusing to app owners why they cannot get the performance they need when they need it—too many variables to tune and too many unknown elements to try and account for, it’s just too complex—so instead what often happens is cloud engineers and operators simply massively overprovision resources to brute force the problem. This is incredibly expensive and is the primary cause of waste and complexity in the cloud today, in our opinion. The Silk platform is built to remove these complex variables and manual tuning elements—to provide consistently high performance under any conditions with an extremely cost efficient and simple implementation that is easily automated.
Elastic and Aerospike Benchmarks
Phew! We’ve covered a huge amount of stuff today—so I think it’s time to wrap. As a finale, I’d like to show off a couple more interesting comparisons, one of a very common cloud database platform, and another of an ultra-high performance modern database to show that Silk even accelerates databases built for the cloud.
Let’s first look at an Elasticsearch benchmark—a well-known cloud search distributed database, built to derive performance from sharding and horizontal scaling. This isn’t a common use case for Silk, as Silk is built to drive vertical performance, BUT, you can attach dozens of Elastic instances to a single Silk Data Pod and drive far more performance than you can get by sharding it into lots of smaller instances. In this use case, reducingthe number of instances and resources being used while increasing performance is a cost and efficiency win.
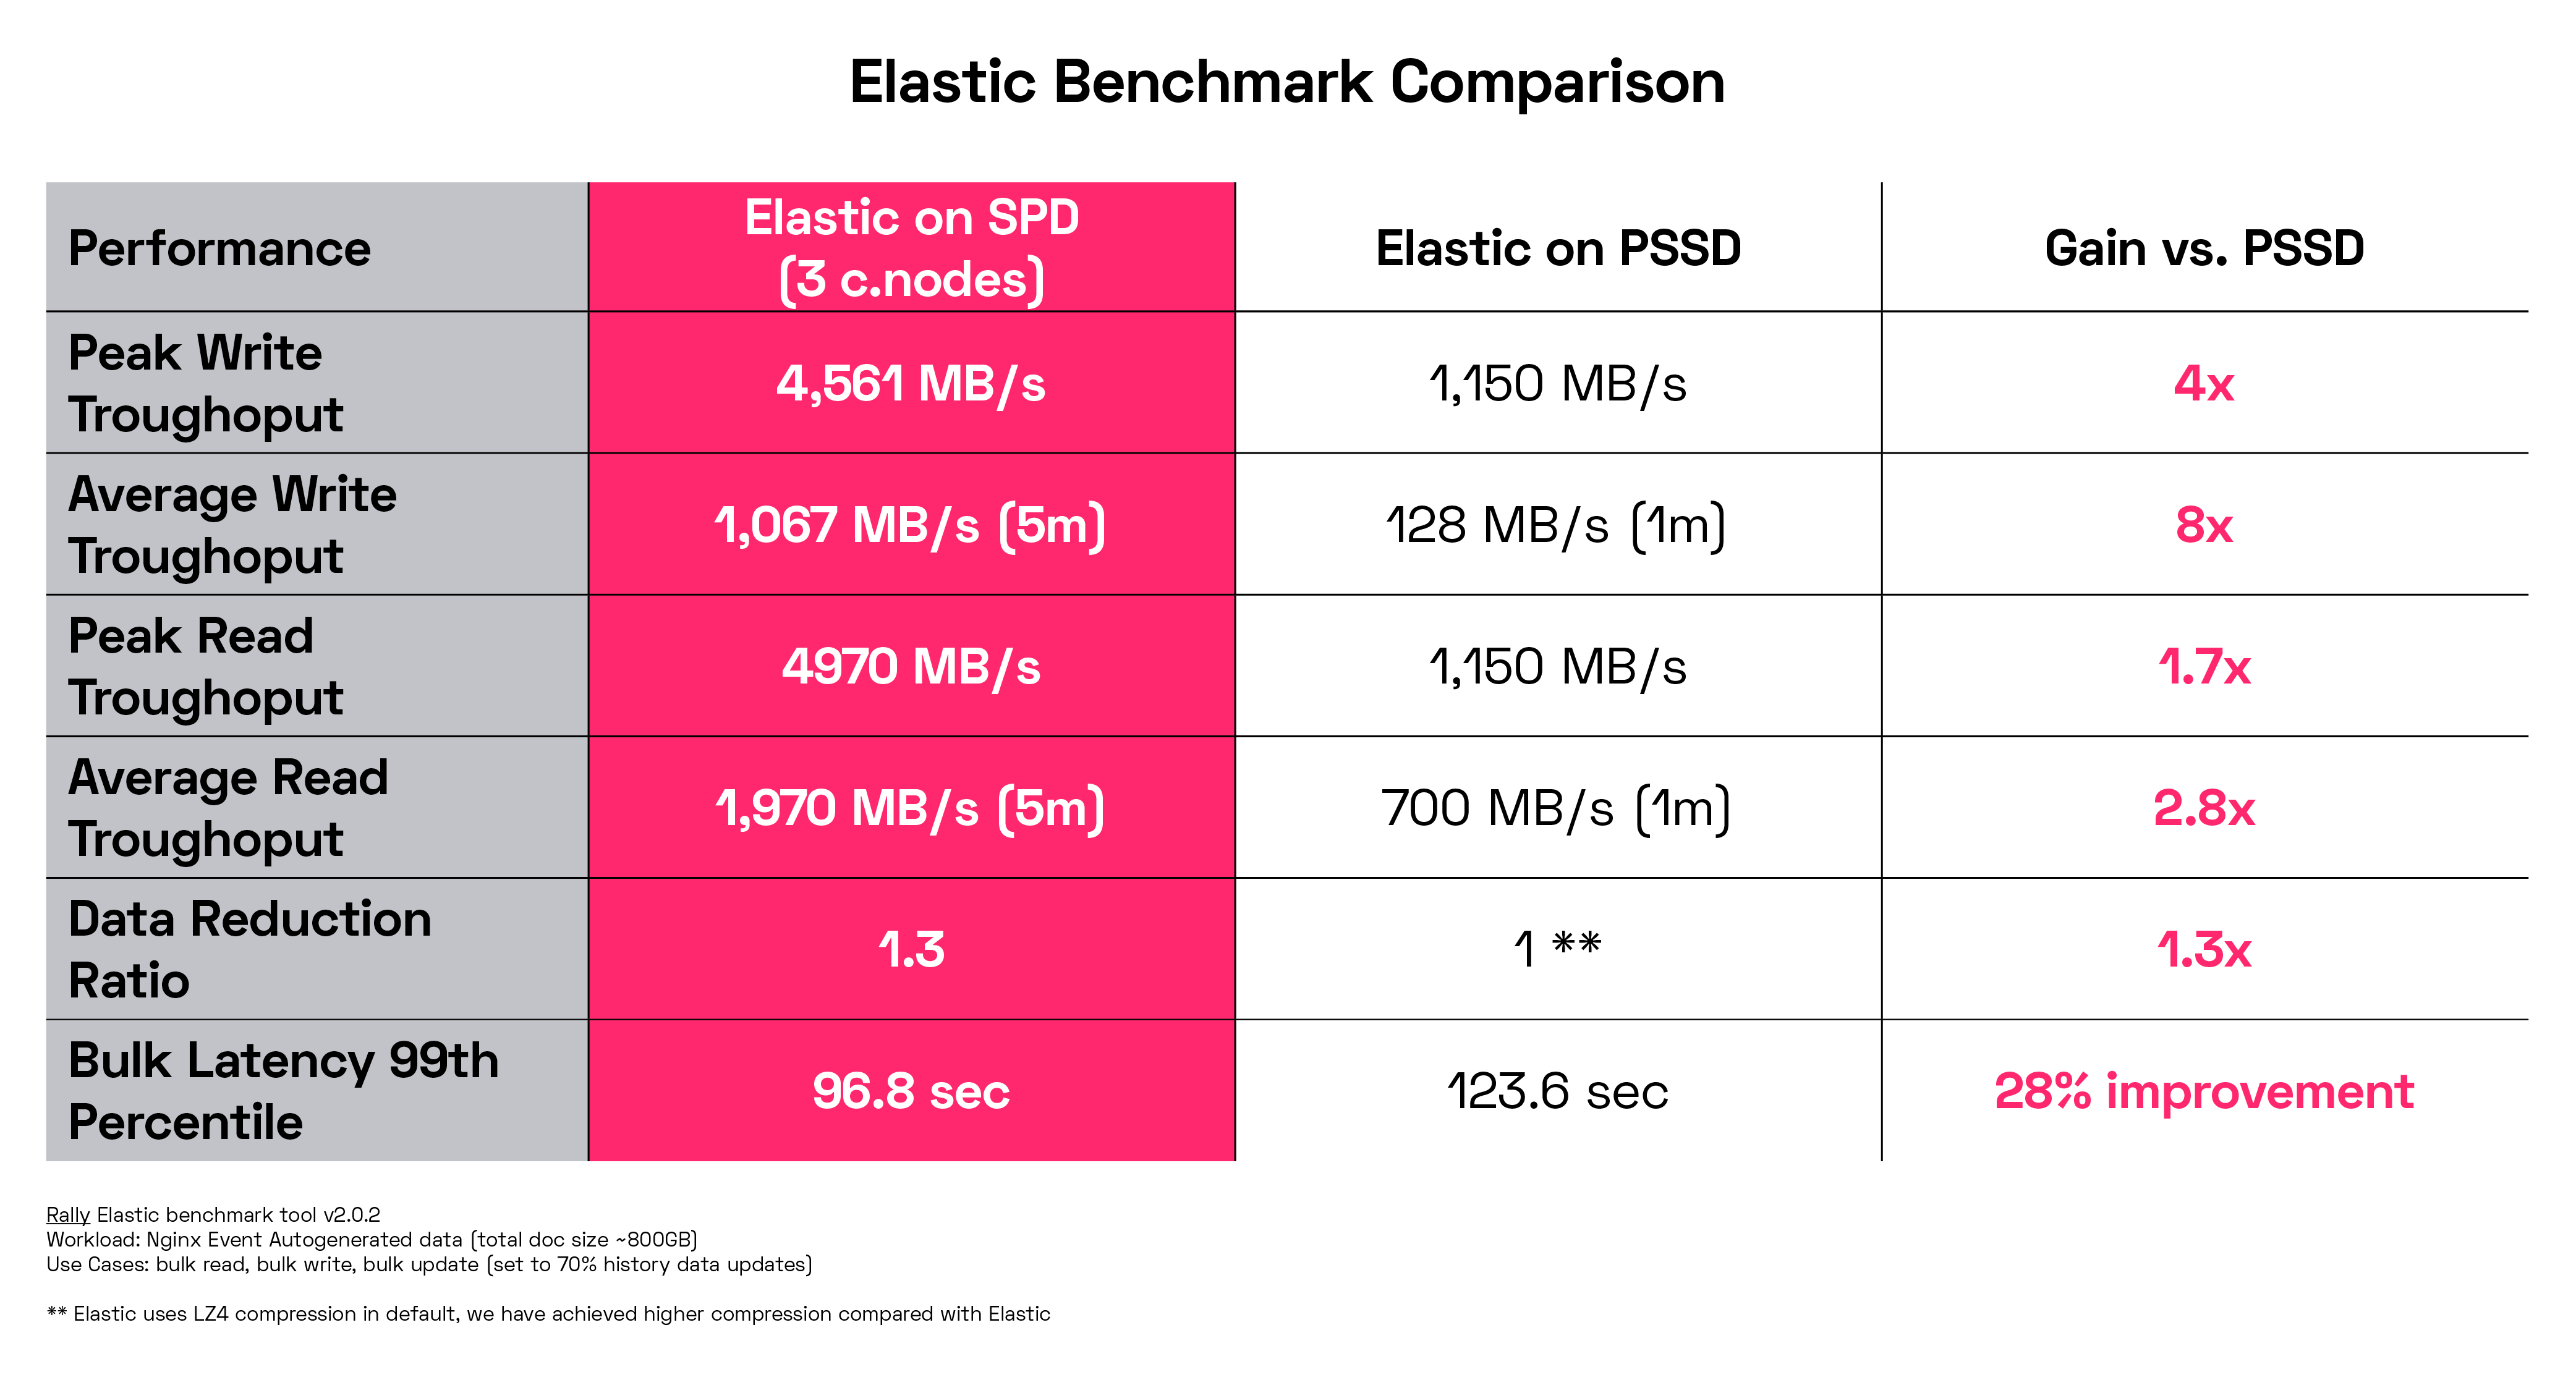
As you can see, a small 3 node Silk implementation drives far more data than GCP Persistent SSD. Because of the far greater performance headroom, Silk can consolidate into fewer instances your database footprint, reducing your compute, database licensing and support costs. This is true for Oracle and SQL as well—fewer instances doing more work at faster speeds without having to overprovision additional compute capacity. It can be a huge reduction in cost and complexity to deploy Silk, depending on your current licensing models.
This is incredibly valuable to everyone who is running into significant database licensing costs!
Reduce your footprint. Gain more performance. Simplify your environment. Gain agility.
Lastly, let’s look at the world’s fastest High Performance, Enterprise-Grade Key-Value Store Database, Aerospike (that is, according to Aerospike, but we’ll stipulate to it). You can look at a whole bunch of performance benchmarks on the Aerospike website, if you feel so inclined. Suffice to say they are built for speed and claim to be the fastest anywhere. Alright, I’m down with that. Let’s see what Silk did to improve the already incredibly fast Aerospike database.
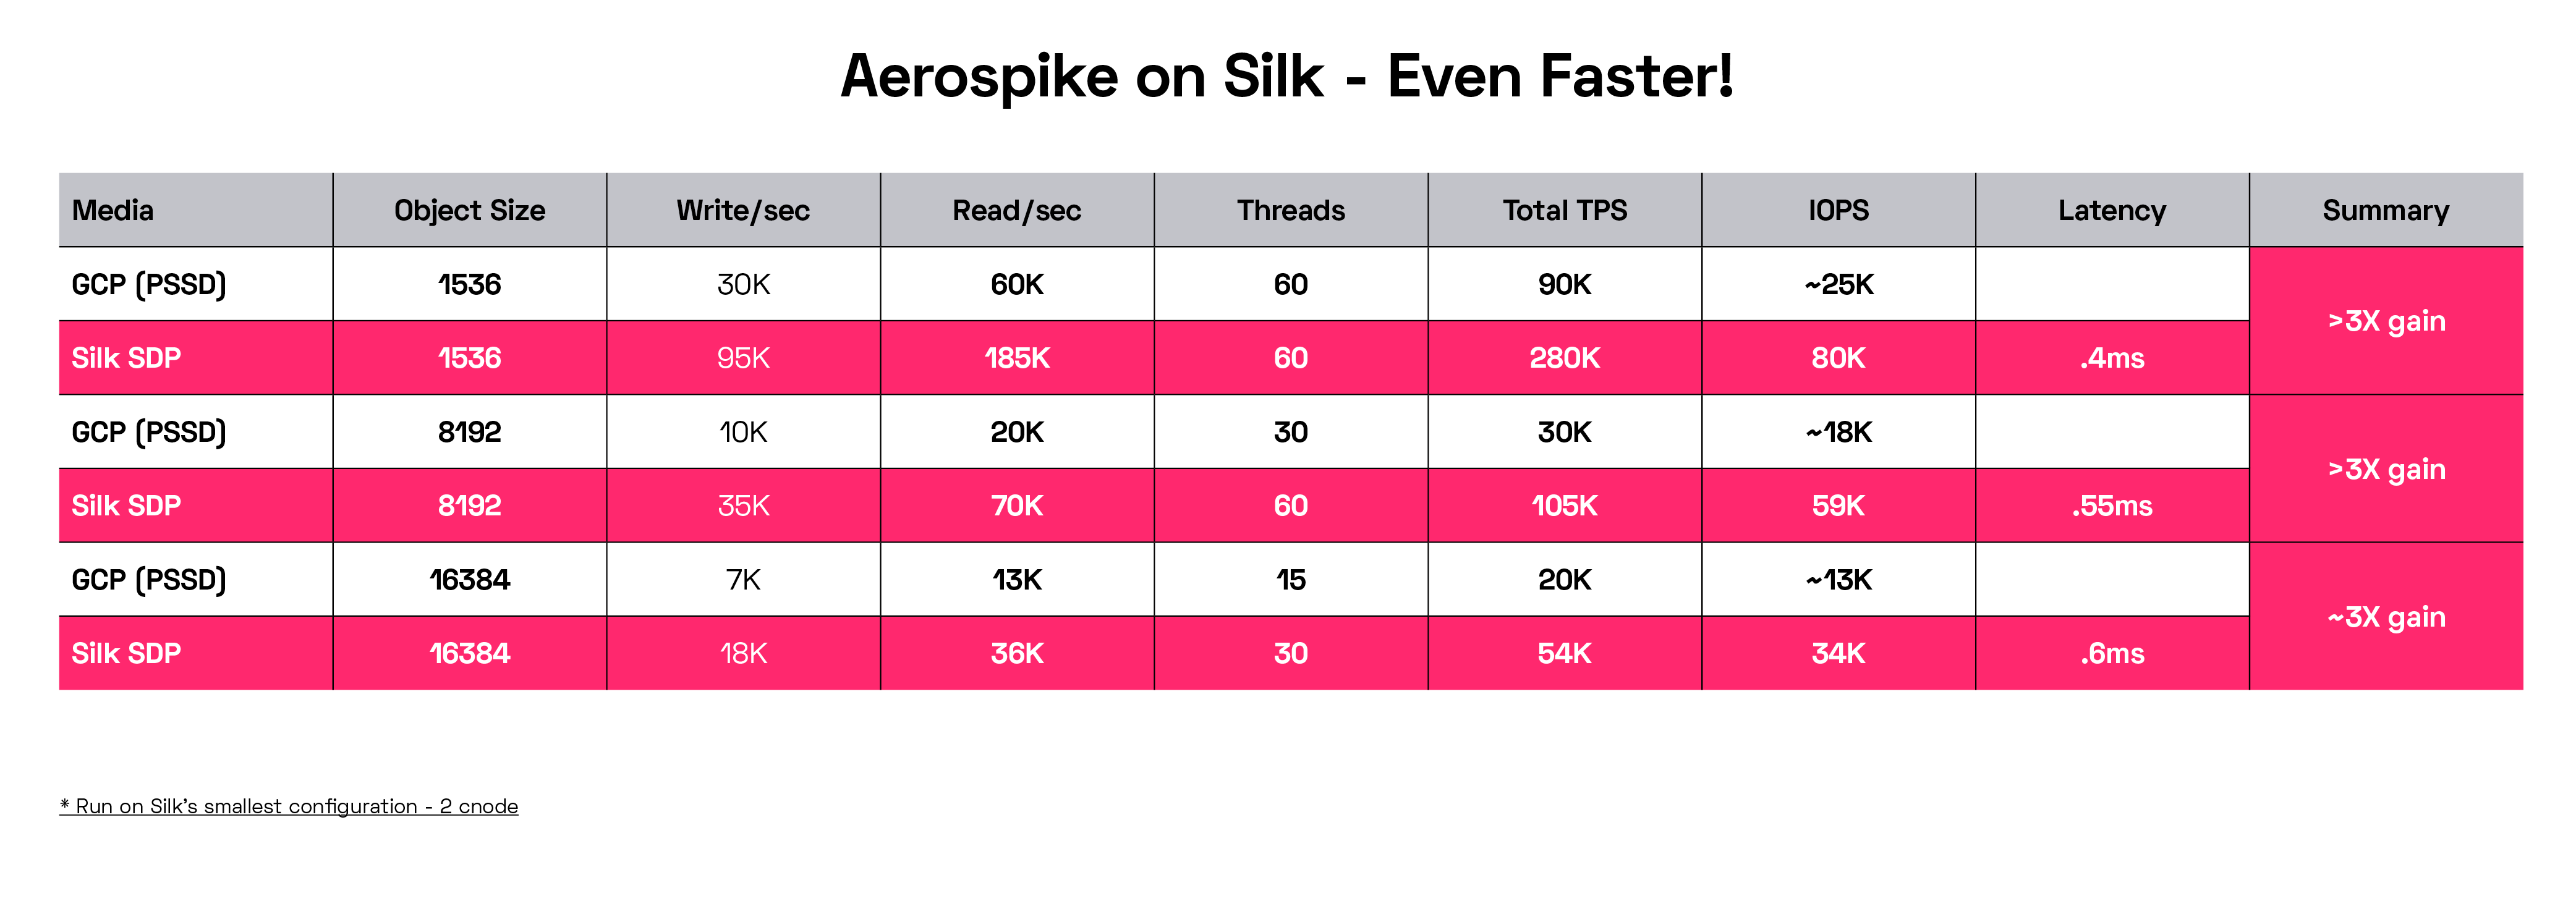
Running benchmarks against GCP SSD-PD with Silk’s smallest 2 node configuration, Silk was able to effectively triple Aerospike’s performance on every common object size, for both reads and writes, with latencies that are almost invisible—400 microseconds is extremely fast. This was on Silk’s smallest configuration. If we scaled our config up and then pumped up the volume on the test hosts massively, 10x gains would be easily achieved. What do we learn from all this?
Silk can take the fastest database out there and make it TEN TIMES FASTER, no problem!
I think we’ll end it there—I hope I’ve shown that the Silk platform is built to handle the requirements of modern and traditional databases of any type—SQL, NoSQL, relational, key-value, search engine—and hugely improve the performance while at the same time shrinking the costs of those platforms. Silk will reduce your costs, simplify your architecture, increase your feature/functionality, de-risk and accelerate your mission critical cloud adoption efforts, and provide you order of magnitude improvement in your business applications and outcomes for your customers.
Want to give Silk a try on your own databases? Let’s set up a demo for your team!