Hello again everyone. I hope you’ve been enjoying our fun little adventure with our friends at NetApp, doing some performance comparisons between Silk and NetApp Cloud Volumes ONTAP running on AWS. We’ve been running the tests which NetApp has published in a whitepaper on our own cloud data platform and comparing the results. So far, they’ve been extremely interesting! As promised, today we’re going to do a comparison on the final NetApp test, labeled Mixed Reads/Writes.
We’ll also take it a step further and look at how Silk did on another Mixed Block workload with a range of different sizes and different patterns of read/write, because as we’ve said many times: real world workloads are quite different from what we see in canned tests. It’s a good starting point to be sure, but we need more context and advanced profiling to really show what works and what doesn’t. We’ll do some of that today. After this, in our next post, we’ll break down some real Oracle and MSSQL workloads to show you how Silk conquers real-world database performance problems and what that means to your business outcomes.
You can review my previous posts on how NetApp and Silk compare on 4K Random Reads, Transactional/OLTP workloads and Sequential Reads and Writes here.
How Silk and NetApp Differ
If you’ve been following along with this series, you know the drill: The Silk platform is a modern, auto-scalable, symmetric active-active architecture that delivers extreme performance across any workload profile, leveraging cloud native IaaS components, while NetApp is using a legacy non-scaling single or dual active architecture with disk aggregates configured from EBS disks. You can find more in-depth information on how our architecture differs from NetApp’s in our previous posts and read about our patented unique cloud architecture in our own whitepaper.
Today, we’re going to look at a 16KB Mixed read/writes test – 50% reads, 50% writes, and 100% random access. This test is supposed to show (I think) that when you have a variety of applications running, you will have a different mix of block sizes, R/W ratios and random vs sequential access patterns, and that this particular test of a 50/50 mix of 16K blocks is somehow a true representation of the average of that entire workload mix and is a valid performance test of those kinds of environment. Allegedly.
Ahem. With all due respect—if you will, allow me… to retort.
While it is true that applications use a variety of block sizes, access patterns, IO request sizes and read vs. write ratios, each one of these IOs are handled discretely, not as an aggregate, and certainly never as an average. Discretely meaning non-continuously. Not prudently, if you were confused on the meaning—that would be discreetly (I aim to enlighten as well as entertain). Where was I? Oh yes, averages. Let’s take an example. Two cars, one going 10 MPH and one going 100 MPH on a road. The speed limit is 55 there. Would we then say the average speed of the cars traveling on that street is 55 MPH and everything is fine? It is true, from a certain point of view.
OF COURSE WE WOULD NOT SAY THAT! THE CAR GOING ONLY 10 MPH IS AN ABSOLUTE HAZARD AND SHOULD BE STOPPED AND TOWED OFF POSTHASTE. The 100 MPH car is just fine, thanks, we’re not crazy people here. Same kind of story goes in data handling. The road handles each car at the speed it is going discretely, your data platform handles IO requests in the read or write size that they each individuallyarrive as. Averages mean nothing here. If your platform cannot handle 100 MPH IOs, but is tuned to handle 55 MPH IOs just beautifully, does that mean the application is running perfectly? Shall we put up the bunting then? No, of course not, your platform has started blocking the 10 MPH IOs as a result and now your application is on fire and your phone is going crazy with whatever your company labels a “Severity 1” problem. Es muy malo, chico, no? Cierto.
See? We vigorously assert that this test isn’t particularly useful! But we’ll do it anyways, to be fair. Then we’ll do a real mixed workload test. Alright, we’ll move on, but the point is this: If your platform cannot handle VARIABLE block size workloads in any access pattern, but instead is using fixed block sizes, your applications will suffer from performance problems anytime the IO request size is NOT exactly that fixed block size. Applications do not request IO in “average” block sizes. Tuning for an “average” is disastrous. Variable block 4-evah!
As you might have guessed, Silk uses a patented variable block algorithm to automatically (no tuning required—it’s magic baby) handle every IO request in its native format, which results in consistent rock-solid low latency and ultra high performance, no matter what (real world) mixed workloads you throw at it. Silk does this discretely. It is kind of our brand. For eight generations of our software now. We totes McGotes own it.
Shall we begin? Let’s look at the tests.
The Results – Mixed reads/writes
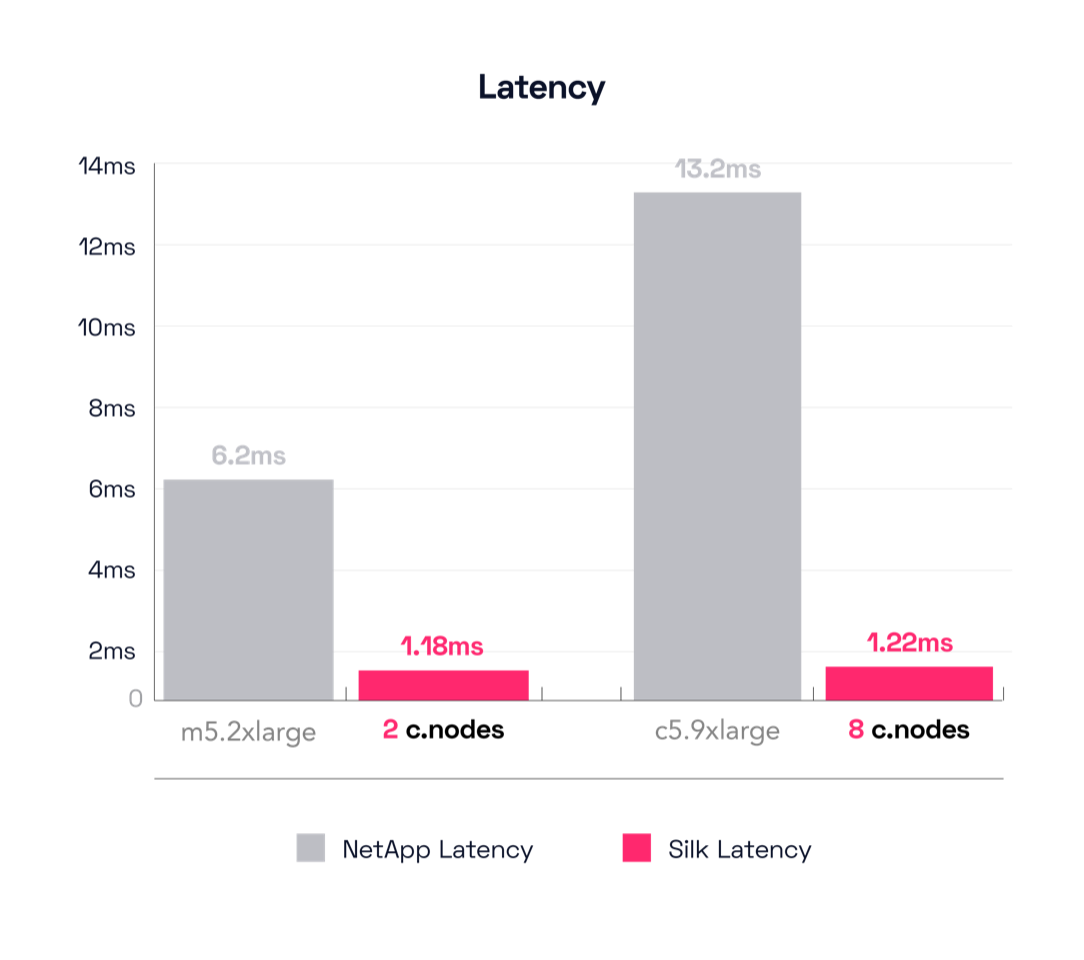
NetApp didn’t have a broad range of results for this test as in others. The smallest config, the m5.2xlarge, drove 384 MB/s throughput at 6.2ms latency which was (in our opinion) far and away their best result. The other configurations provided a bit more throughput, but ALL of them doubled or even tripled the latency of the small m5.2xlarge config. More on that later.
Looking at Silk’s 2 c.node results, Silk was able to push 1,690 MB/s throughput at 1.18ms latency. That’s 340% more throughput at 80% lower latency. That’s an amazing result, but I know what you’re thinking: seen that before, I’m bored, give me something new. Tom Brady always wins Superbowls, yada yada.
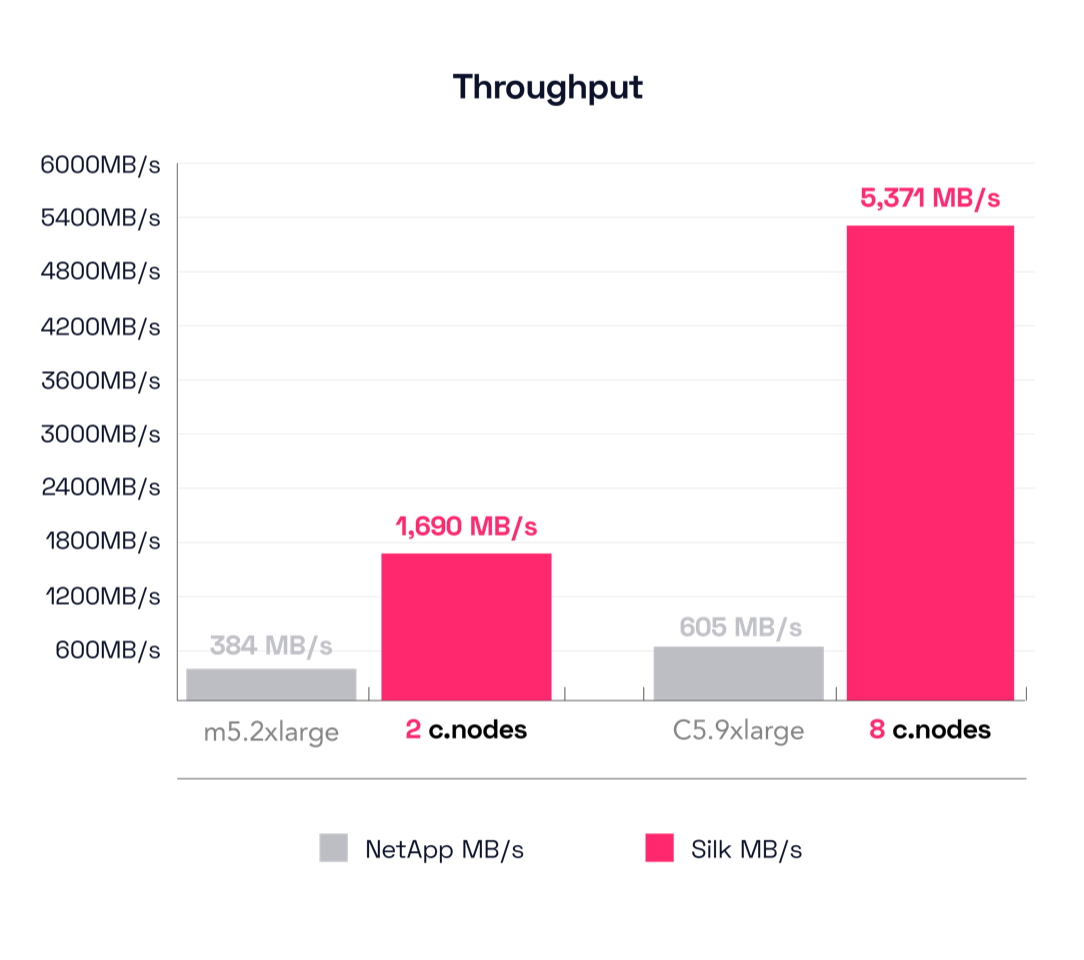
Alright, let’s check the result on NetApp’s largest config, the c5.9xlarge this time. That was able to push 605 MB/s throughput at 13.2ms latency. That’s a mere 57% increase (really, check the math) from the smallestconfig, and yet the latency increased by 112%, more than double. That’s not sparkling, but let’s see what the Silk did before we render judgement. Silk’s big config is able to drive 5,371 MB/s at 1.22ms latency, which is plainly brilliant.
That’s an enormous increase of 787% throughput with a latency reduction of 91%! (cue Peter Griffin Taa-Daaaah.mp4).
Math result for this test? Sure: Silk drives almost 9x more throughput at 1/10th the latency of the NetApp. Your reaction? Cool story brotato, what about the dual active boxes?
Very well, I see you are no longer easily amused, and you’ve become jaded by our little shop of, uh, really fast things.
High Availability Results – Mixed reads/writes
For sure, to be fair, we will look at NetApp’s test of their high availability configuration, which is comprised of a dual-active controller with two disk aggregates linked together in a sync-mirror set. We shall then compare this to the same Silk results as above and redo the math.
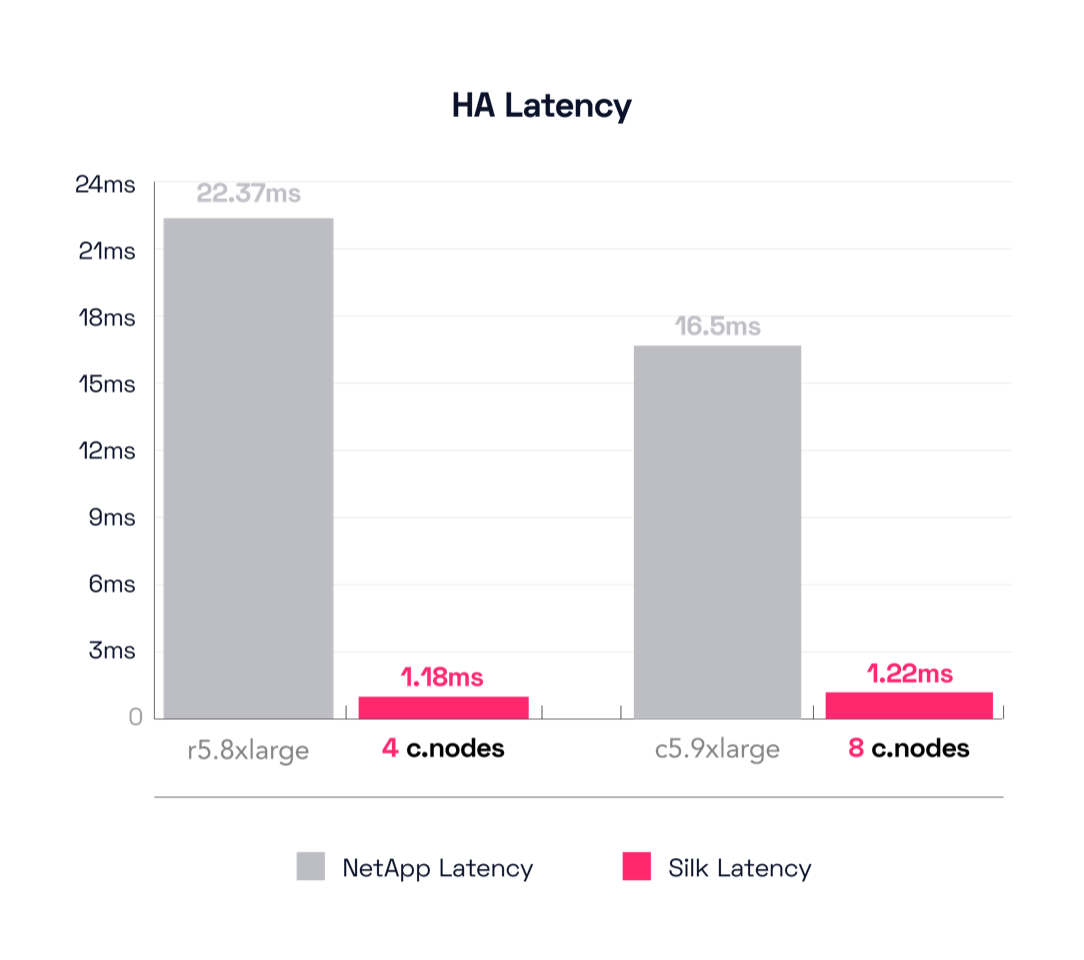
This test uses a different engine for their smallest result, the r5.8xlarge instead of the previous m5.2xlarge. The dual r5.8xlarge is able to drive 663 MB/s throughput at an unhurried pace of 22.37ms latency. Hmm—we’re getting about a 72% increase in throughput compared to the m5.2xlarge single controller config (384 MB/s -> 663 MB/s), but at the cost of almost 4x the latency (6.2ms -> 22.37ms)—tragic, high key. I said earlier we felt their single small config was their best result. The latency delta is why we feel this way. As a reminder, compare that to the Silk 2 c.node config that drives 1,690 MB/s throughput at a lovely 1.18ms latency. Silk is still driving almost 3x the throughput, but now the latency delta is a ridiculous 95%! Yes, the NetApp is taking 1,795% longer time to process IO in this result, 22.37ms compared to Silk’s 1.18ms!
Are you not entertained?! SILKA VICTA!
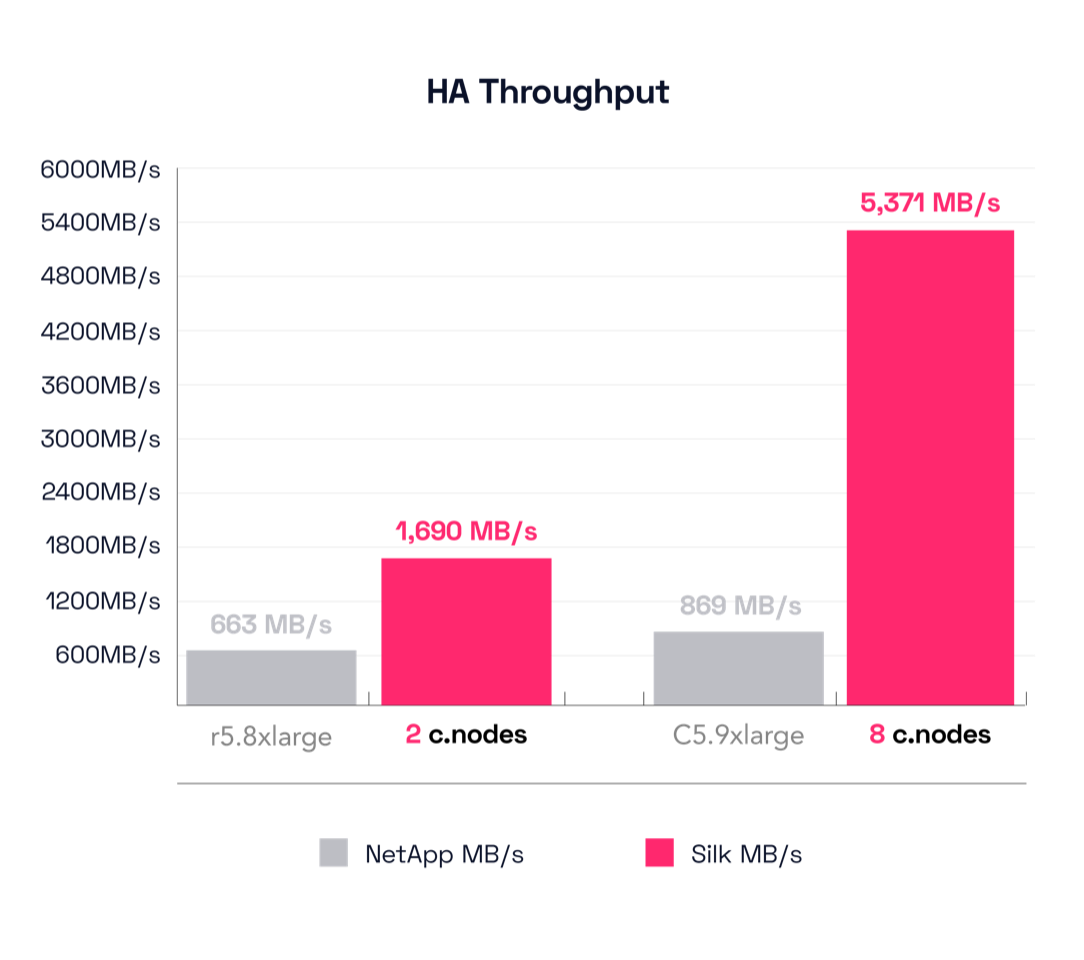
Now let’s move up the stack figuratively speaking and look at the results from the big configs. The largest NetApp for the HA test is still the c5.9xlarge, as before. With this config, the c5.9xlarge achieved 869 MB/s of throughput at a torpid 16.56ms latency. *sigh* Let’s look back and compare this to the single node c5.9xlarge result again—this delta is 605 MB/s -> 869 MB/s for a throughput increase of 43%, but with a latency increase of 13.2ms -> 16.56ms, which is 25% SLOWER than before. *shrug*
We also said there wasn’t much difference across the entire spectrum of NetApp results for this test, remember? Looks like the smallest config is perhaps the most useful of the entire lot. Honestly I was lowkey kinda hoping for more, yanno? There’s No fire! No energy! No nothing! You know I have a show to run here, you know? And it must pop, pop, pop!
To lift your mood, I gently remind you that Silk’s big config drove 5,371 MB/s throughput at a velocious (IT’S A WORD) 1.22ms latency, which is an improvement of 518% additional throughput with a reduction of 93% in latency compared to the c5.9xlarge.
That’s over 6 times more throughput at about 1/14th the latency! Beautiful.
The mind boggles.
Additional Tests
So, perhaps we can now plainly render judgement on the previous results, although we prefer that you, our dear reader, reach your own conclusions. We don’t want to be pushy. Anyways, as mentioned, we weren’t particularly enthralled with that final test pattern (it was rather pedestrian, was it not?), so we decided to run one that was more real world.
This particular result showcases VSI performance, which is typical for app servers of all stripes running in an enterprise class heterogeneous application environment. Plus, we know that everyone runs at least somevirty server for performance, so for those people who need fast VSI, we present to you: Silk! **cue Monty Python Trumpets**
We ran some extended tests with a bunch of guest VMs (up to ten) running different apps. Let’s start by breaking down the workload profiles (I know you want to, you dirty dog).
A few stipulations before we begin, Attenzione!
- We are going to round off numbers this time to the nearest relevant breakpoint.
- We’ll include IOPS, throughput and latency for everything.
- We will NOT mention any overall total averages. That would be silly.
- We concede that the load skew varied as we added more VMs, kicked off more workloads and added more c.nodes into the mix, but declare this a fair representation.
- We encourage everyone to acquire our product and run their own tests.
We found a good mix of 4K, 8K, 32K, and 128K block sizes. The read/write ratios on these block sizes were about 50-50, 70-30, 60-40 and 90-10 respectively. The load skew was about 36%, 31%, 23% and 10%, respectively, with aforementioned skew variance as hosts were added. It’s complex, but these are real discrete results. Yes, there were some minor anomalies that were mathematically negligible, and we’ve removed them (not sulky Neo type anomalies, just regular, irrelevant anomalies, there is no white rabbit here). We’re keepin’ it real man. Relax, unplug.
We accomplished the following results as we scaled our environment up from 2 to 8 cnodes. We’ll chart them out in 2 node intervals to simplify the results but remember that Silk scales granularly from 2 up to 8 one at a time and can even scale beyond 8—for those of you with real big appetites. All of you big ball strikers out there. You know who you are.
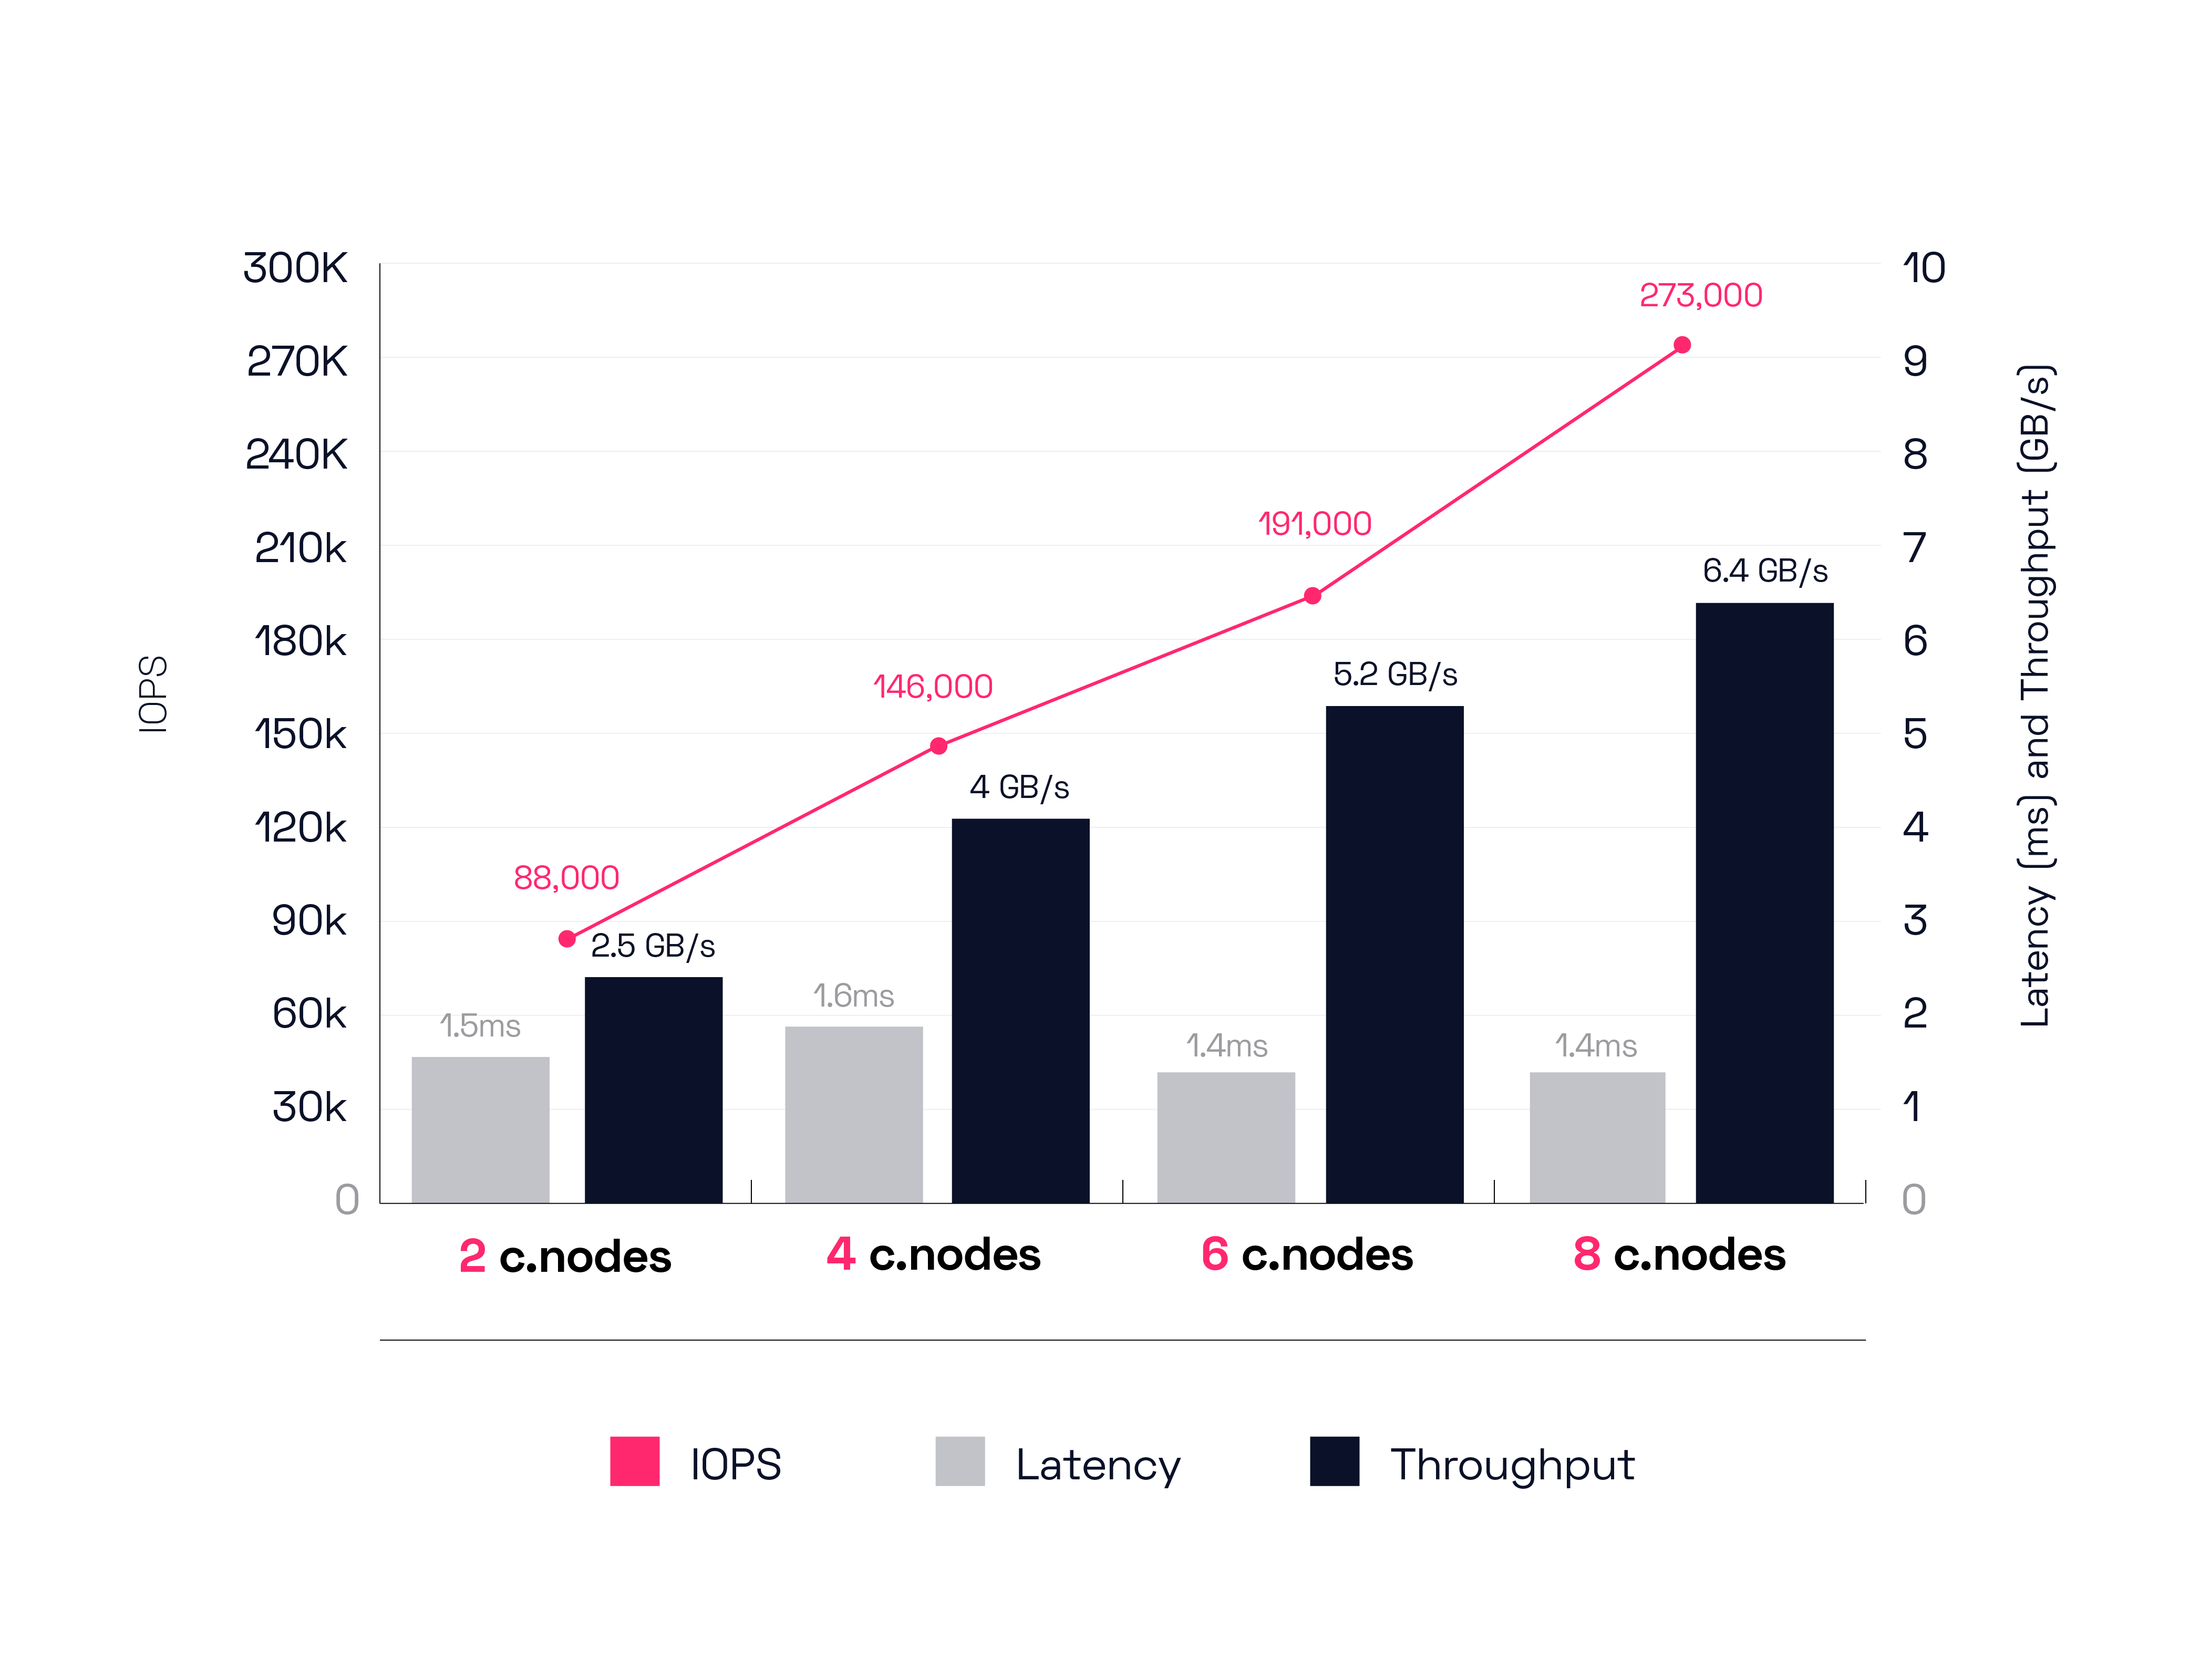
To begin, the 2 c.node config moves 88,000 IOPS yielding 2.5 GB/s of throughput at 1.5ms latency. Next up, the 4-node config achieves 146,000 IOPS driving 4 GB/s of throughput at 1.6ms latency. Scaling up to 6 nodes gets us 191,000 IOPS delivering 5.2 GB/s of throughput at 1.4ms latency.
Finally, our 8-node configuration can push a herculean 273,000 IOPS, driving 6.4 GB/s of throughput at a truly business expanding and customer thrill enabling 1.4ms latency.
With this, we can declare final judgement on our mixed workload tests. We think the Silk outshines, nay, dominates these contests, in every way. Order of magnitude better performance, great ease of use, high scalability, granular cost control, etc.
Kidding aside, the real end result that matters to you, stressed out and overworked digital transformation person who must move everything to the cloud now, is that the Silk platform can enable transformational business outcomes in the cloud that have, in the past, only been achievable on-prem with extremely expensive and proprietary kit. Silk can de-risk and accelerate your move to any cloud and dramatically improve your customer experience, helping expand your top line results while minimizing bottom line impacts. In the real world, the Silk cloud data platform can enable things no other solution can today in the mission-critical customer facing space.
OK, that’s all for today’s tests and the last of our results versus NetApp. We’ve had a bit of fun poking NetApp (who we respect), but I will also add that our comparison tests vs cloud native IaaS and Cloud Managed solutions yield even starker results. 10x better? Pfff, we see up to 50x deltas with some of our testing—vs AWS, GCP and Azure native solutions. Those are stories for another day though.
But in the meantime, there are still more tests we want to run that deal with the biggest challenges of all—transactional and analytic databases. Keep an eye out for our final post in this series as we share how fast Silk can run your most killer Oracle and SQL workloads on the AWS cloud with multiple GB/s of throughput at 1ms latencies. And until then…
Be seeing you John. Fortis Fortuna Adiuvat!