Tanel Poder
Database consultant & performance geek
Co-author Expert Oracle Exadata
tanelpoder.com
This post was originally published on tanelpoder.com and has been reprinted here with the author’s permission
Background and motivation
In an article about high-performance flash I/O published earlier this year, I concluded that modern hardware is ridiculously fast, if used right. With multiple local directly attached NVMe SSDs, we are talking about raw I/O of millions of IOPS and tens of GB/s of I/O bandwidth per server! [1]
But none of that awesome local I/O capacity matters for your enterprise databases, if the datastore does not protect you against data loss and provide shared I/O access for many different servers. You also need fundamental enterprise features like high availability and automatic recovery from hardware failures. And that’s just the basics. You probably want fancier features for your company: data compression and deduplication for reducing cost, snapshots for development, various security, access control features and manageability and ops automation too. So, having fast NVMe flash cards is just a small part of the story in the enterprise data world.
A few months ago I happened to talk to my old friend, Chris Buckel, of Silk. You may already know him as @flashdba. He had read my article and said that Silk’s data platform already offers all the crucial enterprise capabilities I mentioned earlier and uses direct-attached NVMe flash SSDs for performance. And it works in public clouds, or in hybrid configuration with an on-premises installation.
The cloud part got me really interested. Historically, the “elastic block storage” volumes offered by the cloud vendors have not had great performance, at least for people who’ve gotten used to Exadata or Teradata speeds. I know customers who have migrated their databases back to their own datacenters, due to storage performance limitations in the cloud. The cloud vendors haven’t been idle though: there are new high-performance offerings that can go up to 1.6 GiB/s (14 Gbit/s) maximum throughput per compute instance. However, the throughput allowance is tied to requirements like having to launch the biggest compute instance with lots of CPUs and committing to paying for many TB of disk space. This kind of overprovisioning would be needed just for getting the IOPS and bandwidth from the cloud vendors’ elastic block devices, even if you don’t need that much CPU processing power or space for your files.
If you are used to running busy 100TB+ scale databases, you probably realize that 1.6 GB/s I/O speed (for table scanning and everything else) is not that much if you truly need high user concurrency and performance.
The big underappreciated fact is that most of the cloud compute instance types in all major clouds have local directly-attached SSD disks automatically included in the price. The super-fast ones I talked about. But this type of “cloud natural resource” is normally pretty underutilized by enterprise workloads, due to the ephemeral nature of these disks. If a physical cloud machine crashes or disappears (or you temporarily shut down your instance), the data on these ephemeral disks will be gone. But an aggregating software layer on top of multiple such cloud instances, potentially in different availability zones or cloud regions, would solve this problem!
After some discussions, Chris asked if I would want to test out the Silk Platform and write about my findings. Before committing to this work, I wanted to learn more about the platform architecture – I wouldn’t have wanted to spend all this effort on something that wasn’t promising and interesting for my readers too. So I read through the Silk Platform Architecture guide (26 pages)[2] and indeed it did pass my excitement test! Silk is using novel approaches for getting the most out of NVMe SSDs, while offering all the fundamental capabilities that large enterprise databases require.
Since systematic and thorough testing of such a platform takes time, I charged my normal consulting rate for doing this work. I tested the Silk Platform in MS Azure with various I/O heavy workloads, including both OLTP and data warehouse-like stress tests with an Oracle Database.
This deep dive has 5 parts:
- Architecture and internals of the Silk Platform
- I/O throughput for table scanning (for your big data warehouses)
- IOPS, I/O latency and write performance (OLTP and data loads)
- Scaling out I/O performance in the cloud (demo of live operation)
- Summary and architectural opportunities
Architecture and internals of the Silk Platform
Under the hood, the Silk Platform is a software layer that disaggregates the physical flash SSD media from its I/O access and adds all kinds of smartness in between (more about that later). The enterprise apps and databases running in their own cloud instances connect and issue block I/O to the Silk datastore via iSCSI protocol and the software layer takes over from there. As iSCSI support is built into the OS kernel, no extra software is needed in your servers. The datastore has actually two layers – d.nodes for data persistence and c.nodes for compute – and this is where things get really interesting.
In the architecture diagram below, you see a total of 3 layers of interest: the top layer is your regular database and application VMs that use iSCSI (with multipathing) to connect to Silk c.nodes. The c.nodes are where all the magic happens – all the data resiliency and enterprise features are coded into Silk VisionOS software running on c.nodes.
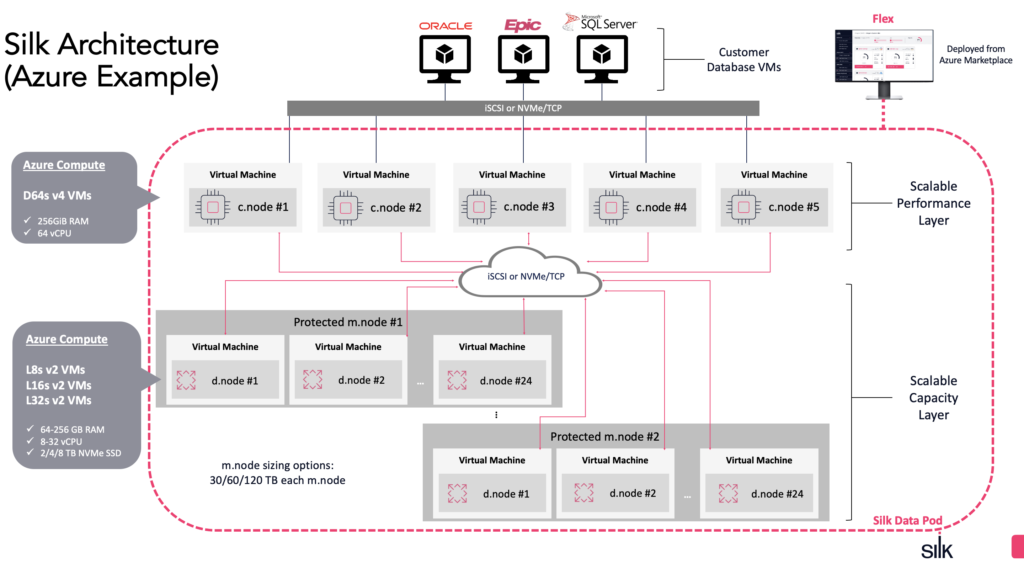 Figure: Silk Platform Architecture
The c.nodes do not store data on their own disks, but they can talk to all available d.nodes that you see in the bottom layer. The individual d.nodes are treated more-or-less like dumb (but fast!) storage, but the Silk compute layer is what pulls all of it together into a resilient enterprise solution.
Two-layer virtualized data access architecture
You can have a bunch of d.nodes just for SSD persistence and a few c.nodes that oversee all the data, regardless of which d.node cloud instance the data blocks happen to reside. This allows you to scale the data nodes and compute nodes independently. For example, if you only need more disk space for your data, just add more d.nodes that are optimized to give maximum storage space per node. Need more IOPS or I/O throughput for moving more databases to the cloud? Add more c.nodes that come with their own CPU power and network paths for additional throughput (with no downtime).
Silk requires at least 2 c.nodes for high availability reasons, but you can scale up and down as needed. You might want to scale up if you’re doing a lot of IO that requires c.node CPU cycles for (de)compression and other metadata ops. Should one of the two c.nodes fail, Silk will keep running and automatically start another c.node to keep the fault tolerance.
The d.nodes with their local SSDs look like a cluster of shared-nothing cloud instances, but the c.nodes are connected to all the data nodes, thus seeing all data over the network. This kind of shared-everything architecture starts to look a little like Oracle Exadata, where the database compute layer can see data in all individual (shared-nothing) Exadata storage cells over the network. Of course Oracle is not pushing down query processing into the Silk datastore, but nevertheless, there are some interesting similarities and benefits:
- Silk c.nodes compress all data using the Silk compute node CPUs, so your database CPUs won’t have to deal with that, and fewer bytes will be moved between the c.nodes and d.nodes.
- In addition to tables – indexes, undo, temp tablespaces all would get compressed, plus anything in your OS file systems stored on Silk.
- Silk performs block level data deduplication and zero elimination in the c.nodes too — that’s done before the data lands on the disk.
- Snapshot and thin clone creation is just a metadata operation at the c.node level, without duplicating data.
- Silk datastore doesn’t cache block reads in memory (just like Exadata storage cells don’t have buffer cache in them) as the best place for caching reads is the RAM in your database server itself.
- The writes, however, can be buffered in c.node memory and acknowledged before any compression or writing to d.node flash media, as long as at least 2 c.nodes have that write stored in their RAM. So, you won’t endure data loss even if one of the compute instances goes down.
- The last part is useful for achieving low latency for writes, like redo log writes for transaction commits – you’ll see results later in this article series.
All this functionality requires serious awareness of where your data is physically located, how the data is replicated/encoded for redundancy, and who are the “users” of a deduplicated block, etc. This is achieved by keeping track of all the required mapping metadata that has to stay available even across c.node failures. This symmetrically “replicated” metadata update and usage architecture at Silk’s c.node layer makes a whole bunch of disaggregated, shared-nothing flash disks in separate cloud instances (d.nodes) look like one big managed datastore.
Data durability and availability
Silk has gone pretty deep regarding the efficiency of data durability too. The easiest path would have been to just use some sort of software mirroring and then resync or resilver the mirrors upon individual disk or d.node failures. But, instead of double- or triple-mirroring with 100% or 200% of data duplication overhead, Silk uses a proprietary erasure coding algorithm called K-RAID that has only 12.5% of space overhead. This is achieved by having 24 NVMe SSDs per set at the data node level and using triple parity (not mirroring) across all 24 disks.
You could think of striped parity, like RAID-6 on steroids, with an extra layer designed and built having the Silk two-layer architecture in mind. This gives you data availability even in the case of two concurrent SSD failures in each media node (a logical group of datanodes); and data durability (no data loss) even in case of concurrent SSD failures in the group.
Note the word concurrent here – of course when a failure is detected, Silk software will automatically fix it by launching a new datanode instance and rebuilding whatever data is needed there. Thanks to the cloud, extra “hardware” is always available for use. Local SSDs are fast, so an individual SSD failure is going to be fixed quickly and a failure condition will not stick around for long.
Of course, for protecting against disasters and entire cloud region failures, you would need to use an appropriate disaster recovery solution, like Silk volume-level replication or something application- or database-specific like Oracle’s Data Guard.
You can read more about K-RAID in the Silk Platform Architecture whitepaper.
Network throughput considerations
As mentioned before, thanks to using cloud compute instances, Silk can use locally attached NVMe flash SSDs that are present in each instance for data persistence. Modern NVMe SSDs that are directly connected to a server’s PCIe slots can give you extremely good throughput, IOPS, and latency figures that traditional disk controllers are not able to sustain.
Silk’s data platform is using the cloud network infrastructure between compute instances, without the throughput throttling that the cloud vendors’ storage products impose on you. The public cloud platforms use different rules for their block storage vs. regular network traffic between compute instances. For example, if you want to achieve sustained 2 GB/s (gigabytes/s) I/O rate for a database running on the Azure Premium Managed SSD disks, you would need to launch (and pay for) a large instance with at least 128 vCPUs and 2 TB of RAM when using current generation Azure VMs. There used to be hardware-isolated “dedicated host” instances that gave you similar I/O capacity with “only” 32 vCPUs and 448 GB of RAM, but that generation has been obsoleted in favor of fully virtualized ones and will disappear in February 2022. This also means that if your database is licensed by the number of CPUs in the VM, you would end up paying licensing fees for lots of extra CPUs, just to get the I/O throughput associated with the larger cloud instances. There are similar caps enforced also on disk IOPS.
Note that in the above example we are talking about per VM bandwidth and IOPS caps imposed by Azure storage networking. So attaching multiple premium SSDs to this instance won’t allow you to bypass the limit and your database performance may suffer.
Since the cloud compute-VM networking has different rules and higher caps, it is possible to deliver higher I/O throughput to a single cloud instance running an I/O heavy database, without having to overprovision CPUs and RAM for cloud instances in order to achieve the required performance. The general VM-to-VM networking within an AZ is not throttled as much as disk I/O, likely due to higher backplane bandwidth compared to even the VM-to-premium-SSD network that’s used by the cloud managed services. I’m not sure if there are some fundamental underlying reasons for that, but it may well come from network topology constraints driven by datacenter compute vs. storage node placement, power, and cooling requirements.
I will write about the actual numbers and I/O rates in the following parts of this article, but it’s worth mentioning that using the cloud networking layer for high performance I/O also requires seriously thought out scale-out architecture to be used by the datastore itself. You can’t just magically stick 500 TB of NVMe SSDs into a single cloud VM and expect it to deliver data to all your database servers at a faster rate than its network bandwidth cap allows. That’s why even the minimum Silk configuration uses multiple c.nodes and d.nodes, each with their own network transmission capacity that will add up to total throughput of the platform. This leads us to the scalability section of this post.
Scalability
You might want to scale the Silk Platform up for a couple of reasons: increasing the amount of space for storing more data or increasing the I/O throughput needed. Thanks to the virtualized architecture, you can add compute nodes independently from data nodes. Silk allows you to automatically scale down the datastore size (both compute and data nodes) without downtime. This is especially useful when running Silk in the cloud: you don’t need to keep running (and paying for) more hardware than you actually use.
Silk software makes all these cloud instances look like one big virtualized datastore. There’s no need to know how many cloud instances are currently backing the datastore – your apps and databases keep doing block I/O against the iSCSI data volumes as usual.
When running Oracle databases and Oracle ASM, you would use ASM external redundancy and let Silk take care of the data fault tolerance and resilience for you. As already said before, there is no need for double or triple mirroring at the database server level. Additionally, no ASM rebalance is needed when scaling up (or down) disk space capacity on Silk block devices, as any required data movement, redirection, and replication is done transparently under the hood by Silk’s software.
Given that Silk supports major public clouds like Azure, AWS, and GCP, it does look like an interesting solution to be aware of when you need to move large I/O heavy Oracle databases from RAC and/or Exadata to these clouds. With the Silk approach, you could benefit from the modern SSD performance in the cloud and have control over your data infrastructure too.
In the next parts, we’ll look into the actual I/O performance numbers from my stress tests!
I/O throughput and table scanning
The next step in my Silk Platform testing plan was to test out the raw I/O throughput, having a large (Oracle Exadata) data warehouse-style table scanning workload in mind – which I will cover in this post. More diverse I/O patterns, like OLTP-style random reads, redo log syncs, and write bursts are covered in the next section.
Since I was interested in the read-I/O raw throughput first, I ran an Oracle parallel query in a loop as a test. I didn’t want to use an OS level I/O stress test (like fio or just dd) as I wanted to test the I/Os exactly as an Oracle Database is issuing and handling them, so I used an Oracle database for that!
I picked a simple-looking, but I/O-intensive SELECT query that scanned through the entire ORDER_ITEMS table and just counted all the records in it. However, the scanned table was big enough so it wasn’t using any caching in the Oracle buffer cache memory. This way all the table scan I/Os were Oracle’s direct path reads that caused Oracle processes to read blocks in from the disk:
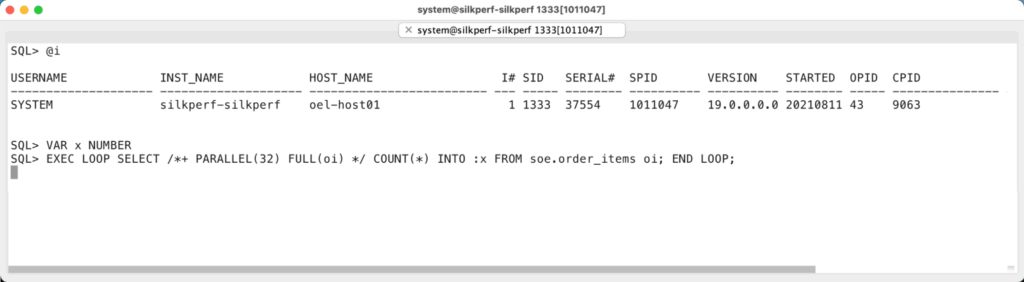
Figure: Oracle Parallel Query for table scan I/O throughput testing
These direct path reads are large I/Os (typically using 1 MB I/O size), issued asynchronously and concurrently thanks to the prefetching that Oracle’s direct path table scans can do. So, even a single Oracle process can have multiple large I/O operations ongoing at the same time, keeping the disks busy! In addition to that, I ran the query with parallel execution, so I had 32 processes doing large, asynchronous reads concurrently, hopefully pushing the I/O subsystem throughput to the max.
As a result, I was (pleasantly) surprised to see that even Silk’s minimum configuration was able to give over 3.6 GB/s scanning rate for my parallel query (yes, gigaBytes, not bits)!
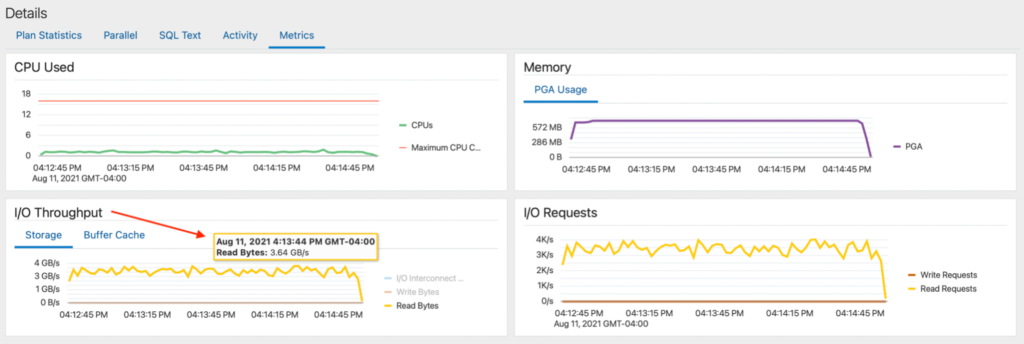
Figure: Oracle SQL Monitoring report for the parallel query
This is impressive, given that we are not dealing with just a bunch of local SSDs visible only to a single machine (that would disappear on a cloud host server crash), but with a shared cloud datastore that has all the required data resilience, redundancy, and enterprise requirements built in.
Here’s the view from the OS level while my parallel query loop was running: The dstat tool printed an output line each second, so when looking at high enough granularity, you see the throughput numbers fluctuating somewhat, probably due to cloud networking. Nevertheless, the I/O throughput didn’t drop below 3000 MiB/s and even spiked to over 4GiB/s every now and then.
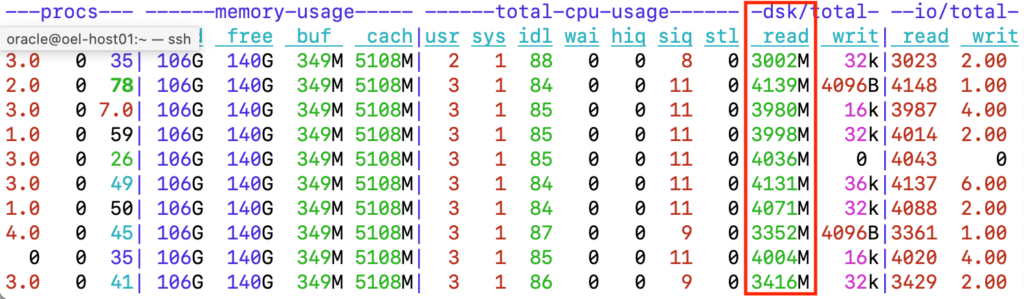
Figure: OS level metrics with dstat while running the parallel query
The CPU usage of this 32 vCPU server is pretty low with this workload. 2-3% of total CPU capacity is spent in user-space as I designed this query to do as little on-CPU processing as possible. With real workloads doing complex SQL processing, you would see the majority of CPU time spent in user mode by Oracle processes and not so much by the OS.
When adding kernel mode CPU together (sys + siq), we get 9-12% of total CPU capacity spent in the kernel mode. This is because ingesting data at 3-4 GB/s rate with iSCSI over TCP and Ethernet means lots of network packets and lots of network packets mean lots of interrupts that need to be handled by the CPU. And in the virtual machine world (including cloud VMs), the interrupt handling is usually somewhat less efficient compared to bare metal hardware that is dedicated entirely to your OS.
The interrupt rate and associated CPU usage is tunable. For example, when running on-premises and in the cloud environments that support jumbo frames (AWS), you could enable larger transmission sizes that would reduce the number of network packets and interrupts. Also, modern network cards that support interrupt coalescing and large send/receive offloading can radically reduce the amount of interrupts raised. This is dependent on your (cloud platform’s) hardware and needs to be enabled in your client OS. Silk has network configuration recommendations in their best practices guide.
Note that this throughput test was using just a single Oracle database on a single cloud VM doing lots of I/O against the smallest-sized Silk configuration in the Azure cloud.
You might ask how a single medium-sized Azure VM can ingest 3-4 GB/s of data over Ethernet as this would mean at least ~35 Gbit/s of network traffic, plus various protocol overhead. The answer is that Ethernet fabric speeds have grown really fast over the last few years and large cloud vendors have 100 Gbit, 200 Gbit (and now even 400 Gbit) network cards in their physical servers.
In this context, allowing a single VM to use 30-40 Gbit/s won’t be that outrageous. Additionally, it looks like there’s more unused “upload” bandwidth available going into a physical cloud server compared to the outwards “download” bandwidth (in Azure at least). This works out well for a database doing lots of reads against a cluster of data-serving VMs, like the Silk Platform.
In enterprise deployments you would likely have many applications on different cloud VMs (on multiple different physical servers) connected to the datastore, further increasing the aggregate network throughput to all clients. With higher demand from all these client instances, you may want to scale up the Silk I/O serving capacity too. In part 4, we will do a horizontal scalability test, scaling out Silk datastore’s c.nodes in a live operation, all while running a database with an intensive I/O throughput test.
IOPS, latency and write performance
After looking into the raw I/O throughput, I moved on to a more diverse transactional OLTP workload doing lots of small 8kB I/Os. I used the SwingBench Order Entry benchmark with 100 database connections to have plenty of I/Os in flight concurrently. In addition to random reads, this workload caused redo log writes for transaction commits and random write bursts caused by DBWR checkpoints.
When you look into the performance chart below, Oracle’s Average Active Sessions was around 60. That is a pretty busy database!
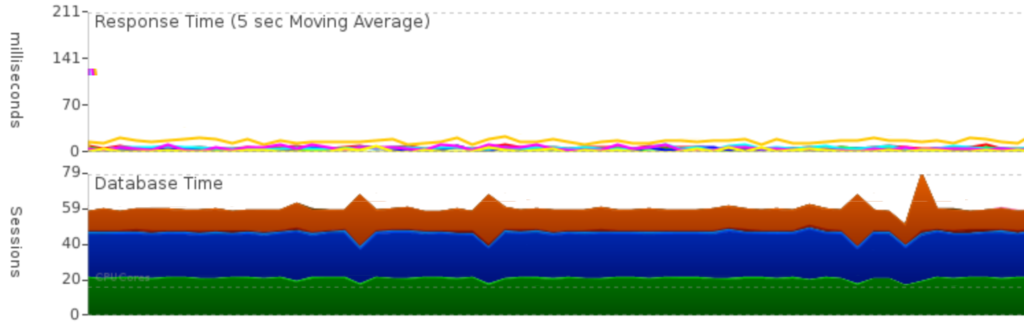
Figure: Average Active Sessions and transaction response time
This stress test was steadily running about 450k transactions per minute. The amount of sessions running on CPU is shown in green, blue is waits for disk I/O, and orange is the amount of sessions waiting for their commit processing to complete. The response time chart in the top (in milliseconds) shows pretty steady response times, without visible spikes in application response time.
Note that the goal of this exercise was not to benchmark the entire database or draw conclusions about your application’s performance, but rather to zoom in to I/O subsystem capabilities when running busy databases on Silk.
So this application ran a variety of SQL operations and wasn’t designed to push only the I/O limits without doing anything else. I just picked a number of concurrent users and increased the workload intensity with a goal of keeping the CPUs busy (but not at 100%) and have the database do at least 10-20k IOPS in a sustained manner as a starting point.
When looking at the I/O numbers at high enough granularity (1-second updates below), the server is doing about 20k read IOPS consistently but the write IOPS range from a couple of thousand to over 90k writes per second!
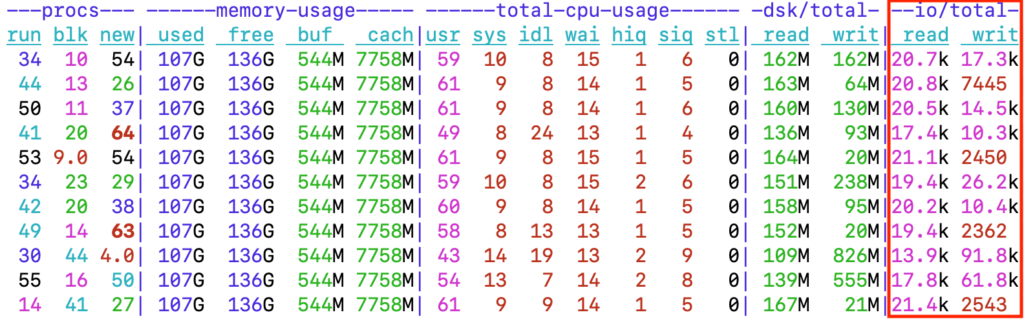
Figure: Linux dstat output showing 20k read IOPS and write bursts of over 90k IOPS
When you look at the 3rd output line from the bottom of the output above, you see 91.8k write IOPs resulting in 826 MB/s write rate. If you do the math, that’s slightly above 8kB on average, meaning that there are lots of small single-block (8kB) writes done in bursts – what’s going on?
The answer is datafile checkpointing and DBWR!
Every now and then, Oracle’s DB writer writes a number of modified “dirty” buffers from its buffer cache memory to disk. This is called checkpointing in Oracle and many other databases’ terminology, although databases like MySQL and Postgres use the OS fsync() system call to make the OS sync dirty pages to a datafile. So you need fast write I/Os and high write throughput or at least bursting capability to avoid causing latency problems elsewhere!
Here’s another example from the Oracle workload I was running, using the Silk performance monitoring page:
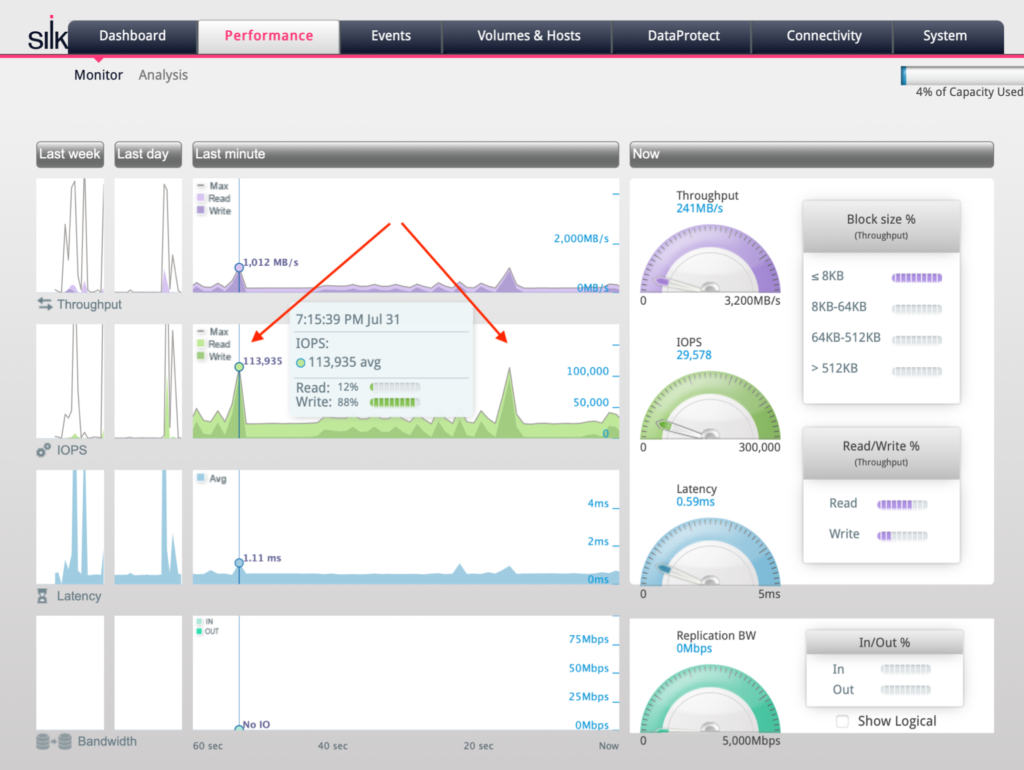
Figure: I/O throughput and latency breakdown on Silk performance monitoring page
As the Silk performance tools have sub-second graph display and update granularity, it is easy to see even short IO activity spikes. From the two green spikes (which the red arrows point to), you’d see that my Oracle database was issuing a large amount of write I/Os a couple times per minute. And when the checkpoint happened, the database issued over 113k IOs per second!
These are pretty significant write bursts that busy OLTP databases do and it’s good to see that Silk managed to not only burst to over 110k writes per second when needed, but the average I/O latency (blue chart above) only jumped from the usual 590 microseconds to 1.11 ms during the short but intense write burst time.
In Oracle, the frequency and intensity of such checkpoints depend on a number of factors, like how many dirty buffers you have, the size and number of redo log files, and a few checkpointing related parameters. If you have worked with very busy Oracle OLTP databases, you may already know that it is possible to tune the aggressiveness of DBWR background checkpointing by setting fast_stat_mttr_target or log_checkpint_* parameters. While this would smoothen out the I/O spikes by keeping the amount of dirty buffers under a certain threshold, it would actually increase the number of total writes done over time.
Note that such write bursting happens in multiple other scenarios in Oracle, even in non-OLTP systems. For example:
- Direct path data loads
- Segment level checkpoints issued before direct path reads start for queries (enq: KO – fast object checkpoint events are waiting indirectly for DBWR write I/O bursts)
- Segment level checkpoints issued on or partition truncate/drop (enq: RO – fast object reuse)
- TEMP I/O for sorting, hash areas, etc.
So, even data warehouses and reporting systems that only run “read only” SELECT queries during the day may be using lots of write bursts that are affecting application performance. So, you do need good write I/O performance too.
Achieving sustained write performance on SSDs
How does Silk achieve good (sustained) write performance while doing lots of I/Os?
Flash media is known to be slower for writes compared to reads and comes with some caveats like write cliffs and garbage collection. On flash, you can’t overwrite just a small 8kB block of existing data in its physical location. That’s just how NAND works – Chris Buckel has actually written about this in his “flashdba” article series.[3]
Typically, the SSD controllers bundle up any block updates and write them all into a new location, leaving the old versions behind. Later on, the controller can erase the entire large NAND block, assuming that the NAND block doesn’t contain any current data – or the old data can be moved away in a defragmentation process. Depending on the SSD controllers, DRAM buffers and flash media wear, this may include unexpected write cliffs and latency hiccups – unstable write performance.
Silk is designed to work with SSDs by generating write patterns that work well with NAND media (log structured writes). Silk’s VisionOS optimizes write I/Os, even small ones, into serial write streams, so that the data nodes only do sequential large writes into the SSDs that can erase and overwrite entire NAND blocks. Silk uses its own metadata structures to keep track of where the latest versions of data-blocks are, so that the underlying SSDs would not have to deal with all these overwrites and defragmentation operations in their firmware.
In addition to the flash-friendly I/O patterns for sustained throughput, Silk c.nodes use a large amount of their memory for write buffers. Writes can be acknowledged when they are stored and propagated to the host RAM of at least 2 c.nodes, to protect against node failures. This gives low write latency as physical SSD writes are not on the critical path of the host I/O. So small-ish sequential writes that your redo log writer is doing complete fast, but also large write bursts done by DBWR would be accumulated in the redundant RAM buffers too. Silk then compresses the outstanding write buffers (into variable-sized output blocks as needed) asynchronously and writes these blocks out to the SSDs. All this happens independently, after the I/Os have already been acknowledged back to the host.
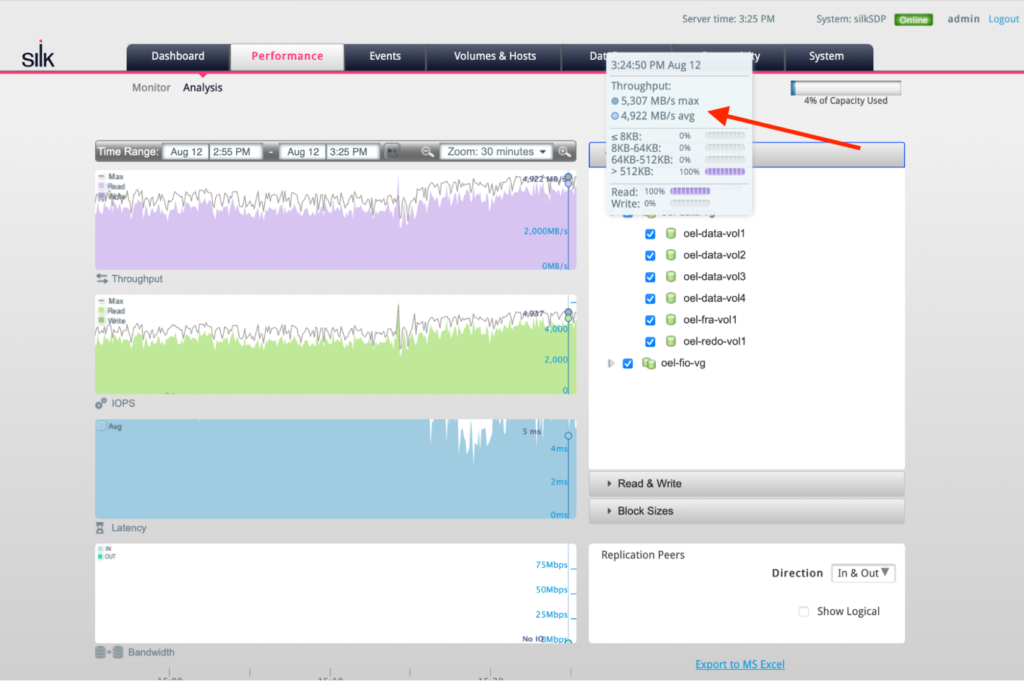
Figure (a): Scanning data at over 5 GB/s. See figure (b) for drilldown into simultaneous redo log I/O.
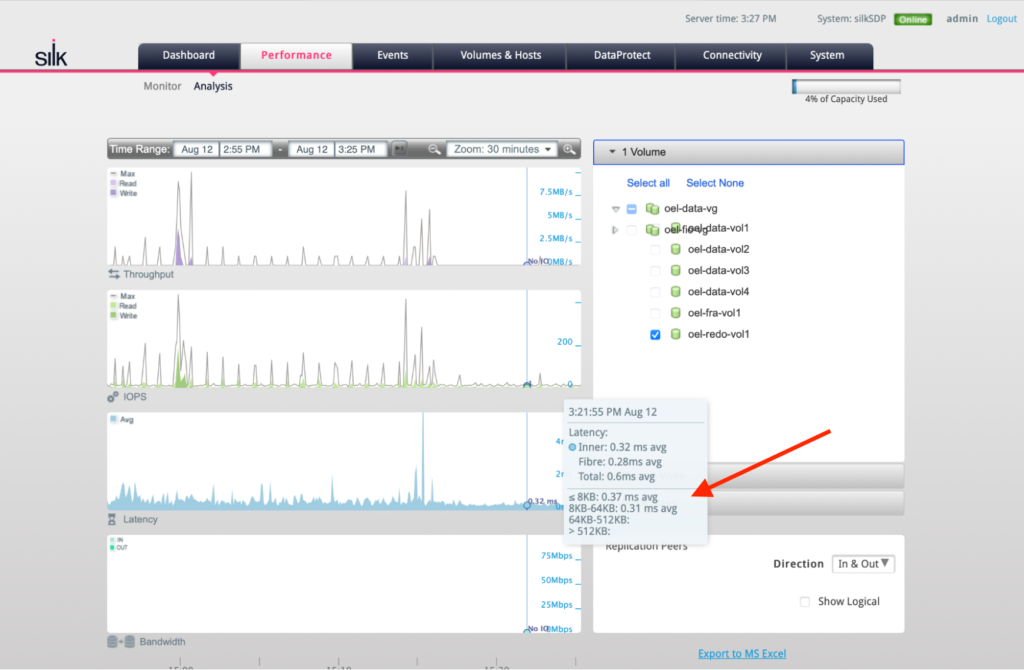
Figure (b): When zoomed in to only Oracle redo log data volume, you see write latencies of 320 microseconds for redo log writes – while scanning data at 5 GB/s at the same time!
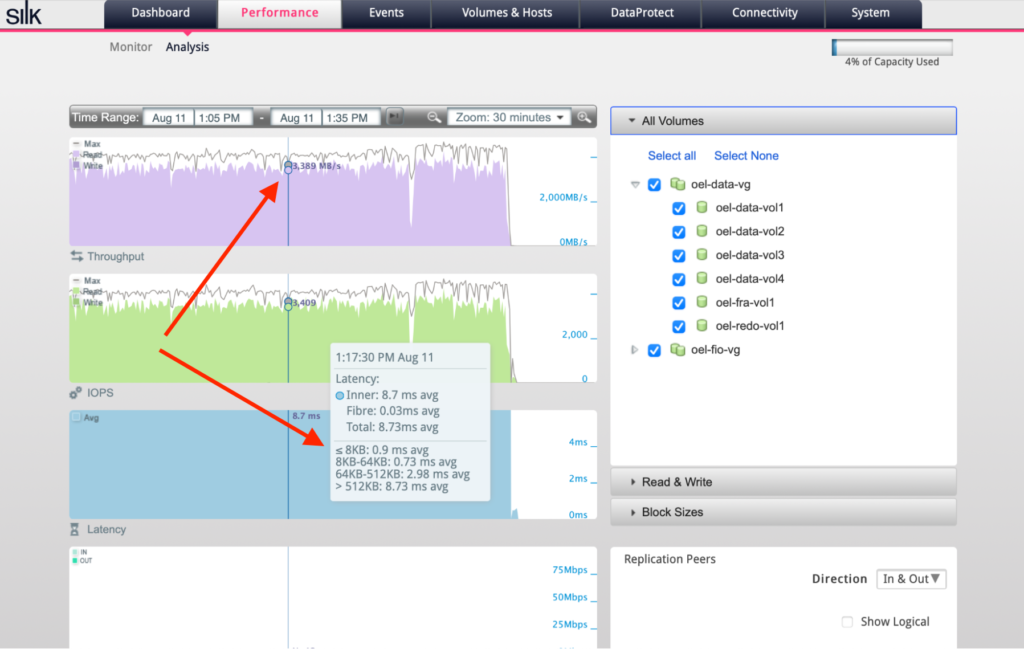
Figure (c): Sub-millisecond I/O latencies for small random I/Os even during heavy table scanning with concurrent large I/Os.
As a side-note, it’s quite refreshing that a DBA-type (like me) can just click around in the Silk monitoring UI and drill down into detailed internal performance metrics with under-one-second granularity. This end-to-end visibility should make database performance troubleshooting and capacity planning tasks much easier.
Scaling out I/O performance in the cloud
I started my tests with the minimum Silk configuration in Azure (2 c.nodes) that gave me around 3.6 GB/s scanning rate with large I/Os and over 350k IOPS when testing 8kB I/O sizes with fio. But for some use cases you may need even more throughput, especially when you have many databases and servers connected to the Silk datastore.
The two-layer architecture allows Silk to scale the amount of disk space and the IO capabilities independently. Scaling up and down are both supported and Silk will automatically move things around as needed. As I had plenty of free space left, I only scaled up the c.nodes for getting more throughput for my single Azure VM instance.
Scaling in Silk is an online operation without downtime. Most of this functionality is baked into the Silk VisionOS, but the client host side logic uses Linux device multipathing on top of iSCSI devices.
Previously you’ve seen the Silk performance monitoring UI (that also DBAs can have access to), but the scaling operations are done in the Silk Flex management UI as you can see below. There is one Azure instance in the Free Pool of c.nodes and I just dragged and dropped it to the 2 c.nodes already used (in the bottom):
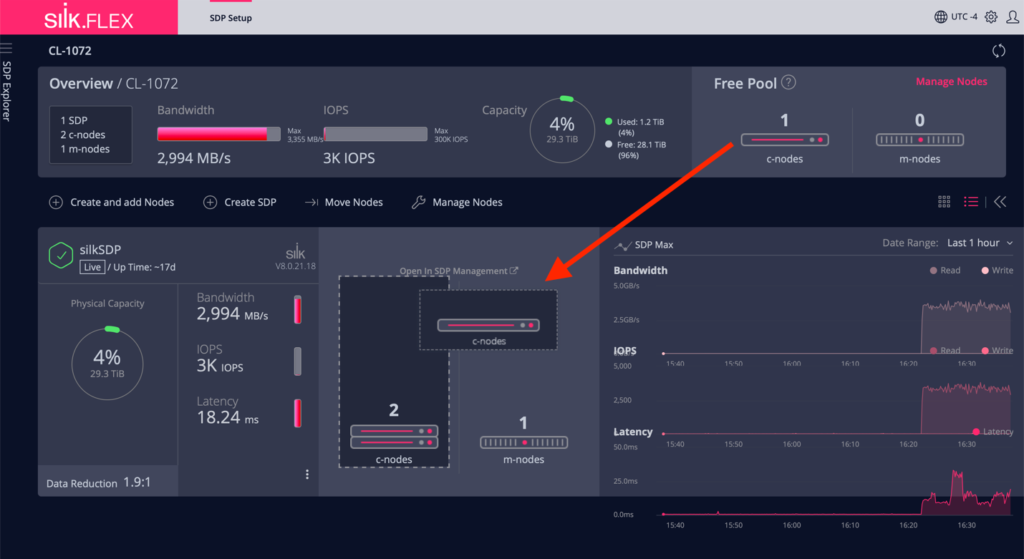
Figure: Adding a c.node to the Silk datastore “compute layer”
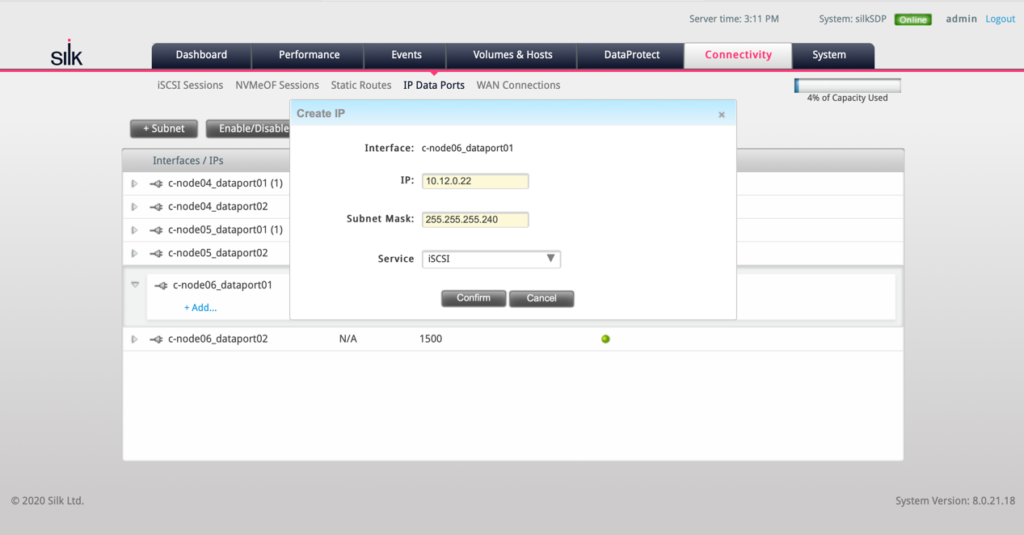
Figure: present an extra iSCSI path (IP) to be used by my Azure VM instance
After the additional iSCSI path and IP to the 3rd c.node was made available, I ran a small Linux bash script in my database server that went through all the existing iSCSI paths and reconnected them. Thanks to multipathing and some deliberate waiting in the script, this was a completely online operation!
With 3 c.nodes, the scanning rate increased from an average 3.6 GB/s to 5 GB/s, occasionally bursting to even more!
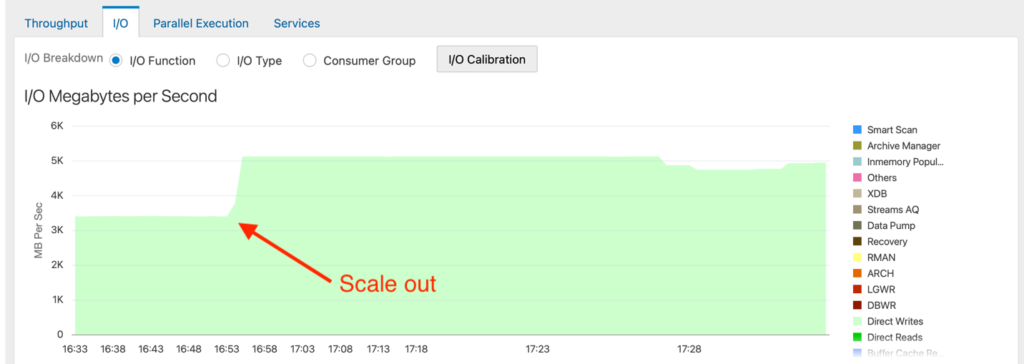
Figure: Oracle large table scanning speedup after scaling
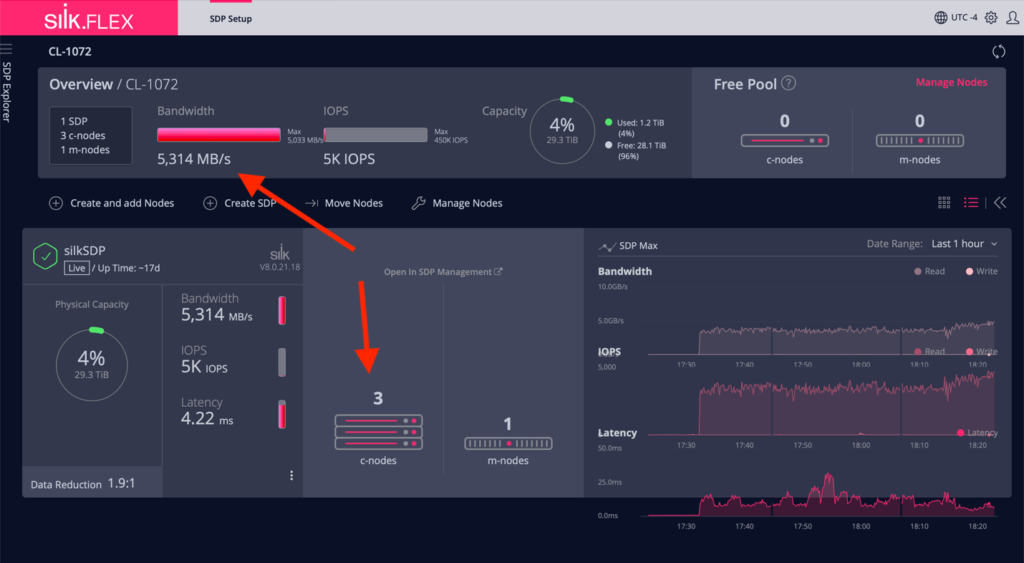
Figure: Scaleout operation completed
When I looked into latency outliers in more detail, there was a period of a few seconds (3-5 seconds or so) during the final stages of c.node addition, where the I/O rate dropped lower. This didn’t seem like a complete pause though, as I/O operations were still getting done, but briefly just had higher latency. In the above chart you might notice a brief dip in the IOPS and bandwidth, but that chart is very granular. With other tools that aggregated data by minute or more, like the Oracle Enterprise Manager chart above, you might not even notice a blip in the throughput.
Summary and architectural opportunities
When running an occasional non-demanding database in the cloud, it makes sense to stick with the cloud vendor’s managed database PaaS offering (like AWS RDS) or run the databases yourself on the cloud vendor’s elastic block storage solution. The PaaS approach would work only if your existing apps can live with the managed database’s restrictions and limitations (database size caps, no OS and network access from the database, etc).
But if you are dealing with a strategic shift to the cloud, you’re talking about many databases and all of them can’t be easily fit into the PaaS model anyway – and then I/O performance questions will quickly come up, hopefully in the planning stage and not as a surprise after the move.
You would probably need to move the large I/O heavy databases into their own dedicated cloud instances and consolidate the remaining hundreds (or thousands) of regular databases to fewer cloud instances for cost reasons – I/O performance is going to be important in both scenarios.
Together with high performance I/O capabilities, Silk’s automated thin-provisioning, thin-cloning and replication features open up a number of architectural opportunities for enterprises, especially given the elasticity of the public cloud:
- Avoid cloud instance hardware (CPU licenses) and disk space overprovisioning just to get the required performance
- Run reporting, analytics, end of day/month processing on temporary thin clones that don’t take extra disk space (and shut down the cloud VMs once done, too)
- First steps to cloud/hybrid cloud: Together with a on-premises Silk installation, you can replicate databases and apps to public cloud for DR and reporting reasons
- Run I/O hungry monolithic databases in the public cloud. This should be interesting especially to people who have already gotten used to Exadata throughput and speed, but have to move their Oracle databases to AWS, Azure or GCP for strategic “bigger picture” reasons
The last point above often raises the question of “How do I run Oracle RAC in the cloud?” Oracle officially supports running RAC only in Oracle Cloud, so what to do in Azure or AWS? I would first reframe the question to “How do I run large and busy Oracle databases in the cloud?” Do you even need RAC for your applications these days? While RAC is a solid and impressive piece of software, it also brings additional license cost and complexity. As usual, there are alternative paths with different tradeoffs, but in the cloud migration scenario, my reasoning is this:
- High Availability: You need Oracle Data Guard for disaster recovery anyway, so why not start from the latest Data Guard features first when evaluating both DR and HA needs? Oracle’s Data Guard has evolved a lot over the years, providing seamless, fast failover speeds measured in seconds and active reporting capabilities on the live “standby” nodes also used for recovery.
- Computing power scalability: As far as scaling up the database server’s CPU and RAM capacity goes, the largest compute instance in Azure currently offers 416 vCPUs and 12 TB of memory. With temporary thin clones or Active Data Guard, you can have additional VMs (with their own CPUs) provide reporting and analytics on copies of the same database. Does your application require more?
- I/O performance and scalability: All this CPU capacity and scaling will not help if you can’t feed your data to the CPUs fast enough to keep them busy doing useful work. If you can’t radically shrink your databases and cache all hot data, you will need fast I/O!And this is exactly where Silk’s platform comes in. It’s cool to see a 3-5 GB/s data scanning rate sustained by an Oracle database, running on a non-Exadata machine in the cloud. And I ran my tests on a small Silk configuration! The platform is designed to scale even further. In the architecture guide, you see examples of 10-14 GB/s throughput with larger Silk Platform setups.
As I wrote in the beginning, I agreed to do this consulting and writing engagement after making sure this product passed my performance geek excitement test. I first read about Silk’s architecture and design – and it looked both novel and promising in the modern “cloudy” days. My subsequent performance testing deep dives showed that, indeed, Silk folks have done an impressive job!
Whether Silk is the right choice for you depends on multiple factors, including which cloud vendor your company is aligned with. If you need to run many large monolithic databases (like Oracle and other classic RDBMS) in the cloud, it’s worth being aware of Silk’s offering.
Call to action:
The technical people might want to read Silk’s architecture guide to see if it passes your excitement test too. You can contact Silk with more questions here.
[1] https://tanelpoder.com/posts/11m-iops-with-10-ssds-on-amd-threadripper-pro-workstation/
[2] https://silk.us/resources/silk-cloud-data-platform-architecture/
[3] Chris Buckel a.k.a @flashdba has written a series of articles for DBAs about how flash (and storage) works: https://flashdba.com/storage-for-dbas/