We’re halfway through our blog series comparing the performance between the Silk Platform and NetApp Cloud Volumes ONTAP for AWS (as published in a whitepaper on NetApp’s website) You can find my first three blog posts where we compared results for tests focused on 4K Random Reads, 8K Transactional/OLTP workload, and Sequential Reads here.
Today, we’re going to look at how NetApp and Silk compare on Sequential Writes. We’ll also take it a step further than NetApp and look at 64K Random Reads.
How Silk and NetApp Differ
As always, refer back to my previous posts about how Silk and NetApp’s architectures differ. In brief: The Silk platform is a modern, auto-scalable, symmetric active-active architecture that delivers extreme performance across any workload profile, leveraging cloud native IaaS components. Performance is our brand, and our system is built to deliver it for mission-critical workloads.
Today, we’re comparing 64KB block size Sequential (Streaming) Write I/O – 100% writes, 100% sequential access. For databases, this kind of workload is created by transaction log writes, bulk loads, backup operations, and by the “L” portion of ETL functions — a very common and extremely important activity in today’s data-driven world. Write throughput is king for these activities, and often times it is THE limiting factor in database performance. Low throughput can dramatically extend operation times, increase iteration times, or cause operations to go beyond allocated time windows.
You also typically see this type of workload generated by applications such as medical imaging machines, video render farms, video surveillance, and other media capture. Latency can also be a major factor depending on the use case—such as media rendering (buffering and dropped frames are very bad)—so it’s an important secondary metric for these tests.
Beyond this use case, we also wanted to showcase small block writes (4K), a test that NetApp decided not to run. Small block writes with latency sensitive IO are extremely difficult to handle for certain architectures, because while it is easy to ingest a small block, the time it takes to act on the block—to validate it, CRC it, mirror it, hash check it, compress it, update the metadata tables, coalesce it into a stripe, commit it, acknowledge it back to the host, and to flush it—is about the same as it is with a large block. However, there might be hundreds of thousands more to deal with lined up behind that IO, whereas with large block, there’s far less IO operations (maybe 1/10th) to deal with, and more time to handle each IO simply because there is maybe 32x or 64x more data in each block being ingested and acted on (less IO, more data). To handle both small and large block writes with high throughput and low latency is extremely difficult for any architecture. Mixing reads and writes together multiplies the challenge. If we then mix in both random and sequential patterns into the workload it’s another level of difficulty again. All of these things can combine to drive performance into the ground, certainly for legacy storage systems that were not built with these complexities in mind. This is where a modern data platform like Silk is really required to handle all these different challenges. Silk was built greenfield to be the ultimate platform for every kind of database workload profile and variable IO mix today. More detail on how we really do this is available in our whitepaper. For now, let’s take a look at our results. They’re really quite dramatic.
The Results – Sequential Writes (64K block 100% sequential write)
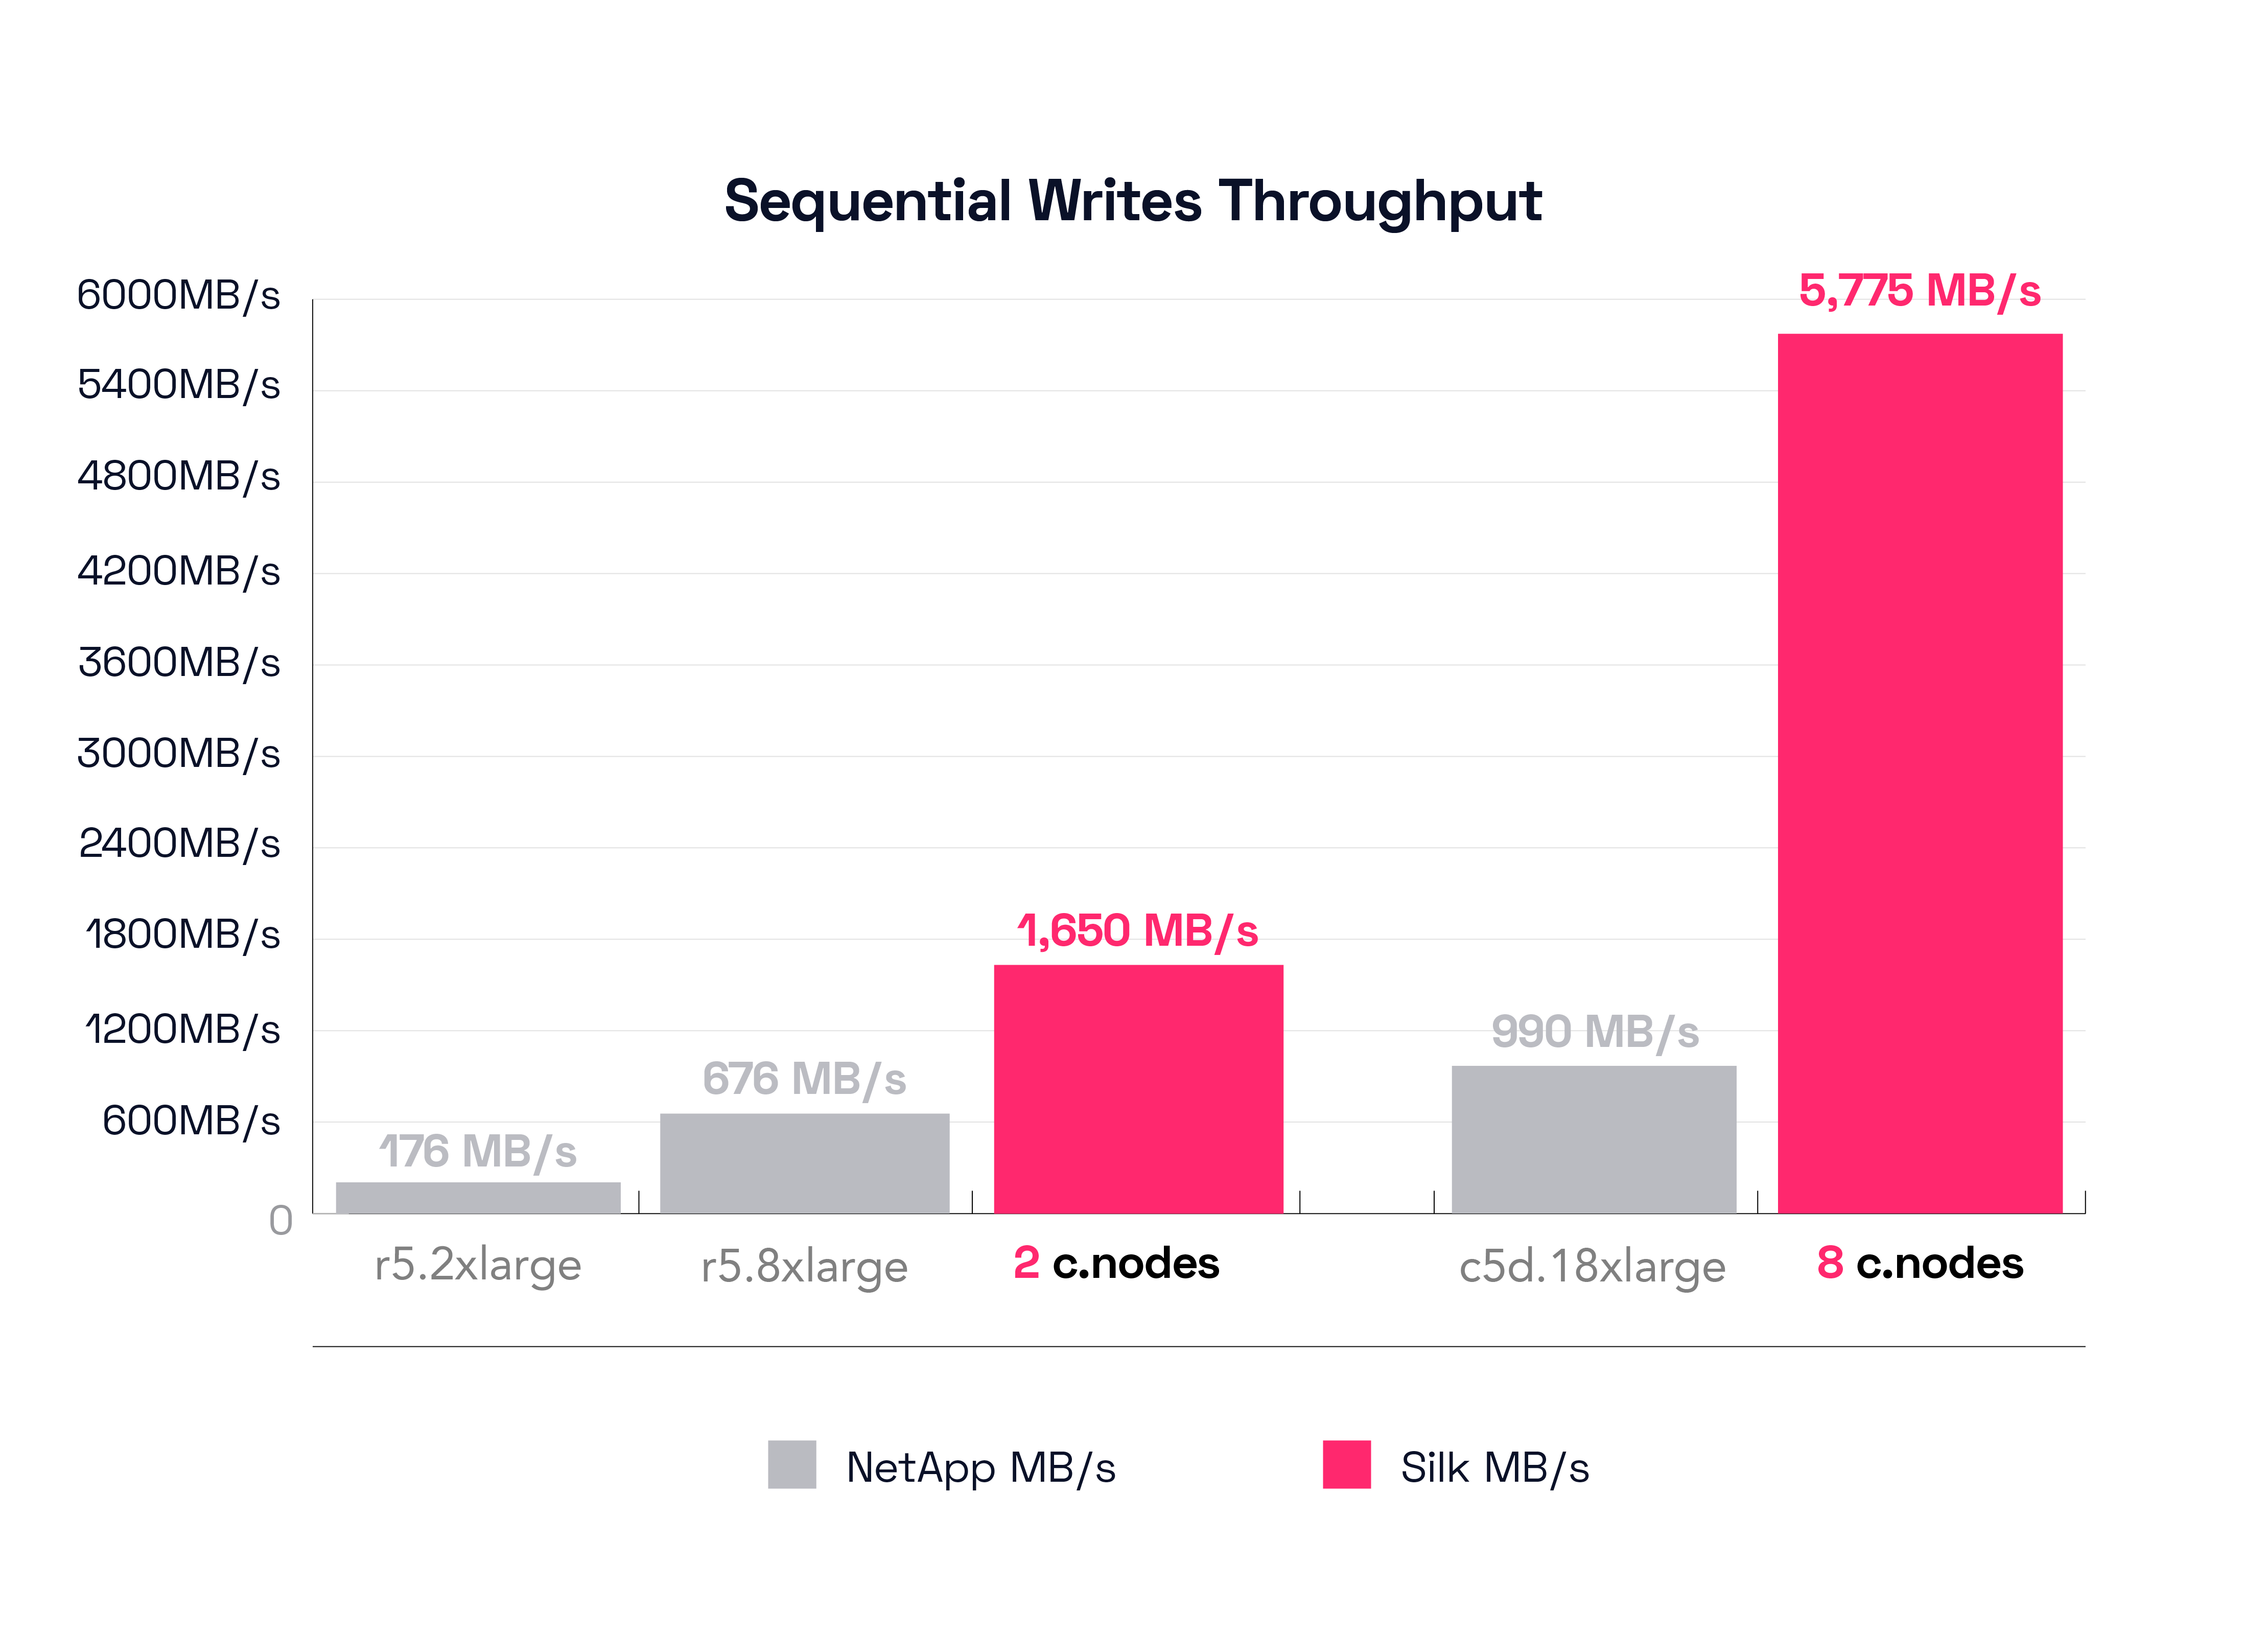
Alright, to start with, we’ll look at NetApp’s smallest configuration result, the r5.2xlarge. Looking at the graph, this config was able to push a mighty 176 MB/s throughput at a glacial pace of 44.53ms latency. This is actually not too bad—compared to an LTO6 tape drive—a comparison exercise for another day perhaps. Let us instead now compare this to Silk’s small config of 2 c.nodes, which is able to drive 1,649 MB/s throughput at a miniscule 0.89ms latency. Yes, Silk pushed ~1.7GB/s of write throughput at 890 microseconds latency. We just have to do the math on this for sure—the Silk provides a 98% decrease in latency while delivering an 837% increase in throughput. In this case, the Silk is literally 50x faster with ~10x more throughput. Yikes!
The second NetApp result on the graph, the r5.8xlarge, is going to be referenced later in our High Availability result analysis section, we’ll just put a pin in that and skip over it for now.
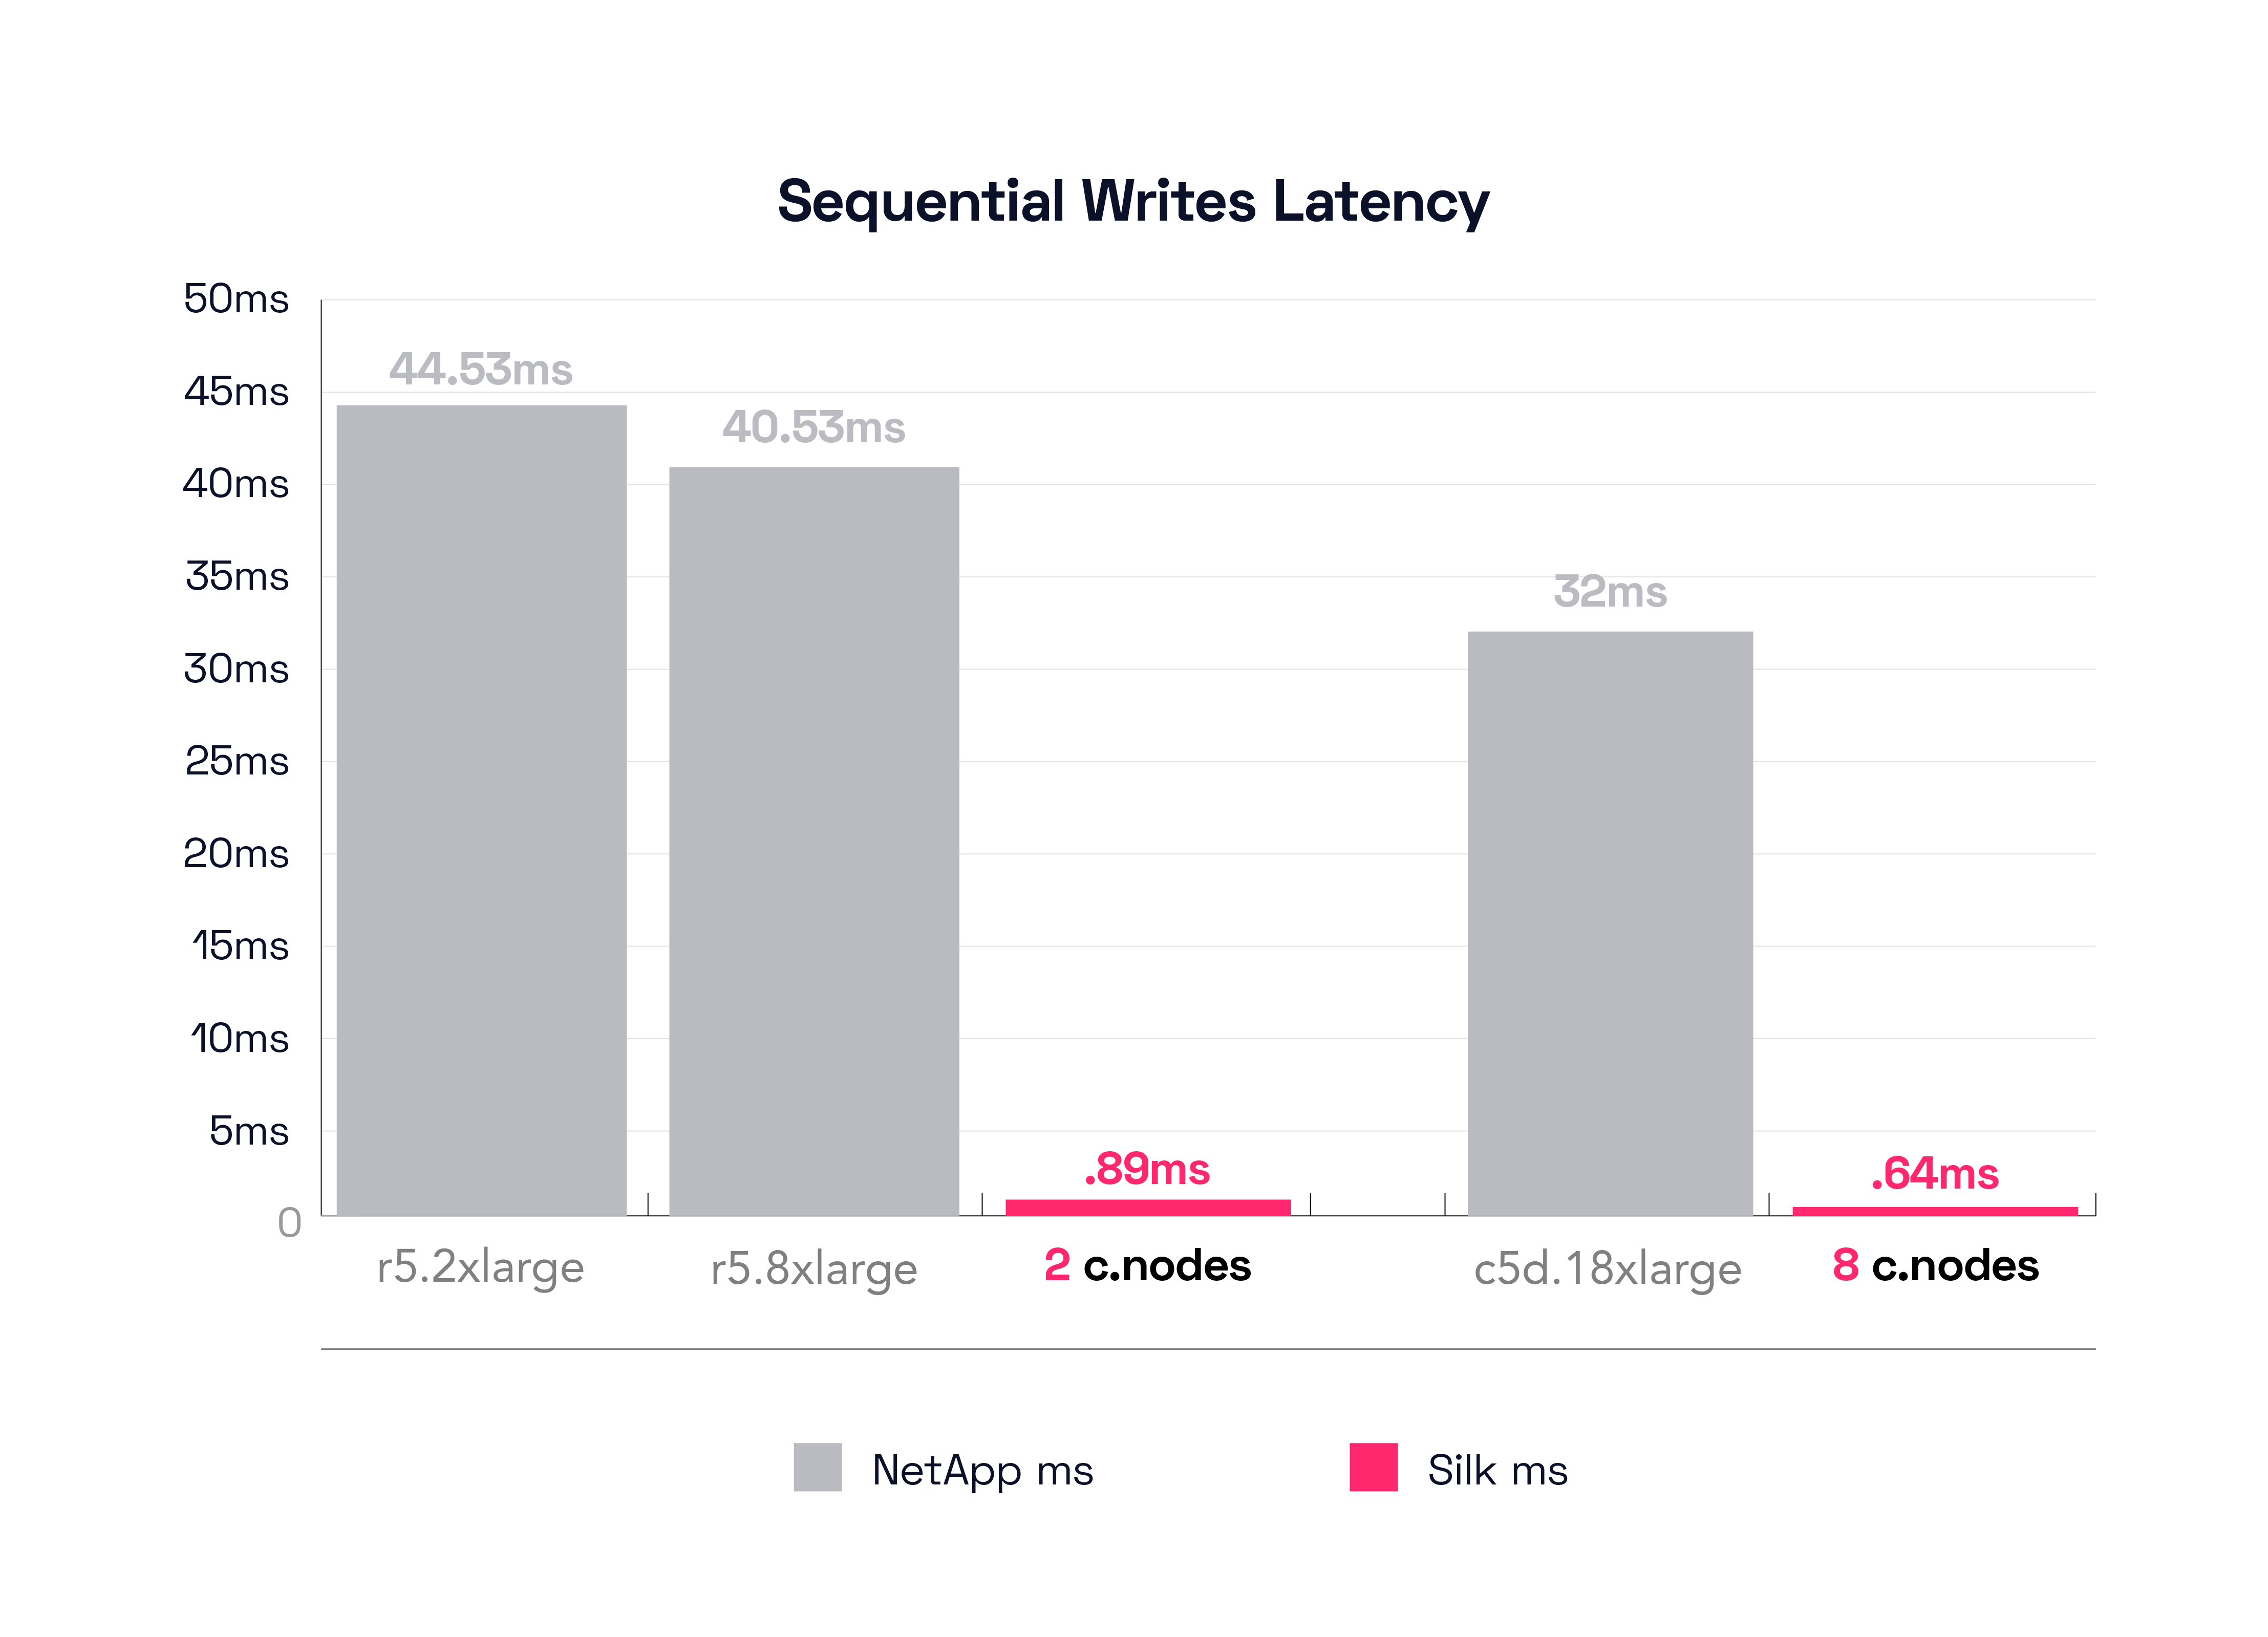
Let’s now check the results on the other end of the spectrum with NetApp’s largest configuration, the c5d.18xlarge. That config delivers 990 MB/s throughput at a similarly hearty 32ms of latency. I might say that this demonstrates a fundamental architectural limitation with NetApp write handling (we shall see how their dual controller system stacks up in a moment). Let’s see what the Silk big boy did on this same test: A lovely result of 5,775 MB/s at 0.64ms latency. Almost 6GB/s of write throughput at 640 microseconds latency, positively stellar. Alright, math again: Silk delivers almost 500% more throughput at 98% lower latency. In this case, there is no contest, I could say it’s like a Mercedes AMG-Petronas F1 racer vs. a Go-Kart, but I don’t wish to insult Go-Karts (they can be quite fun). I kid, I kid.
Test Results – High Availability Sequential Writes
OK, perhaps we’re being a bit harsh on NetApp. After all, they did also test a dual controller configuration, in what they call a “high availability” setup. We’ve been comparing our previous results in this blog series to that specification as well, so let us continue and see if we get a different comparison delta. You can look at their HA configuration in their whitepaper, but very briefly: it’s a dual-active controller with separate identical aggregates linked together with sync-mirror.
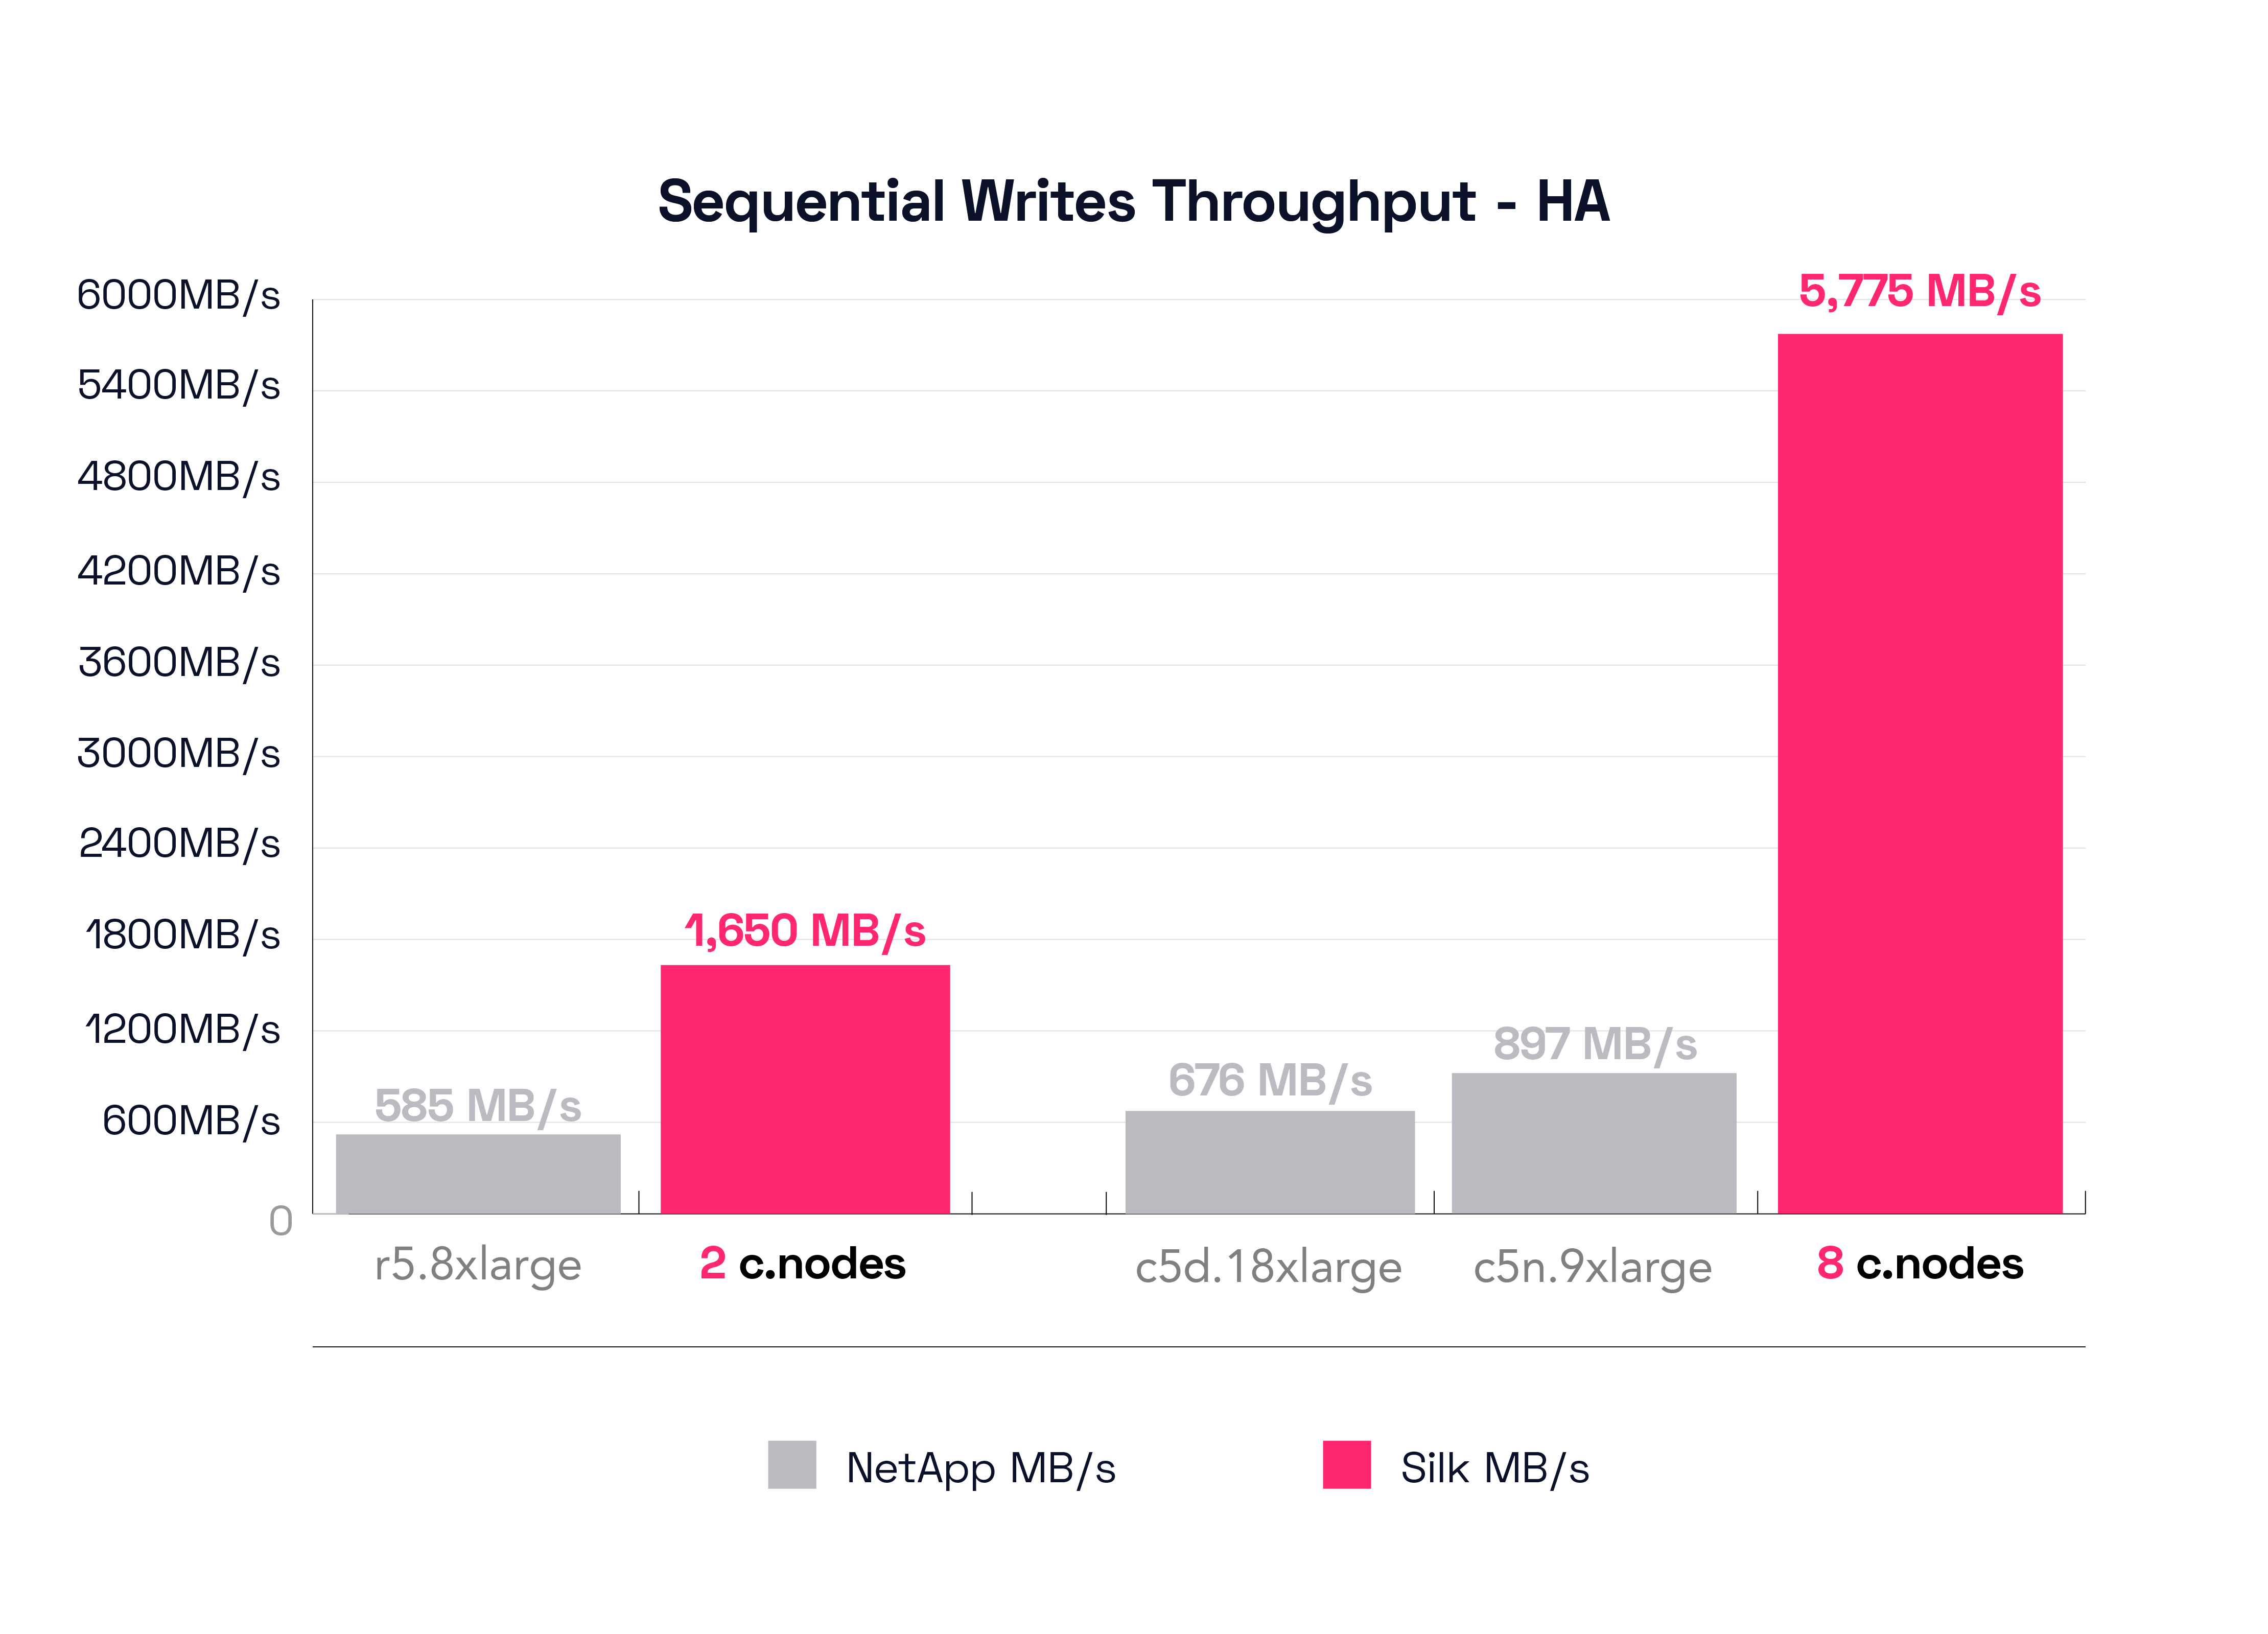
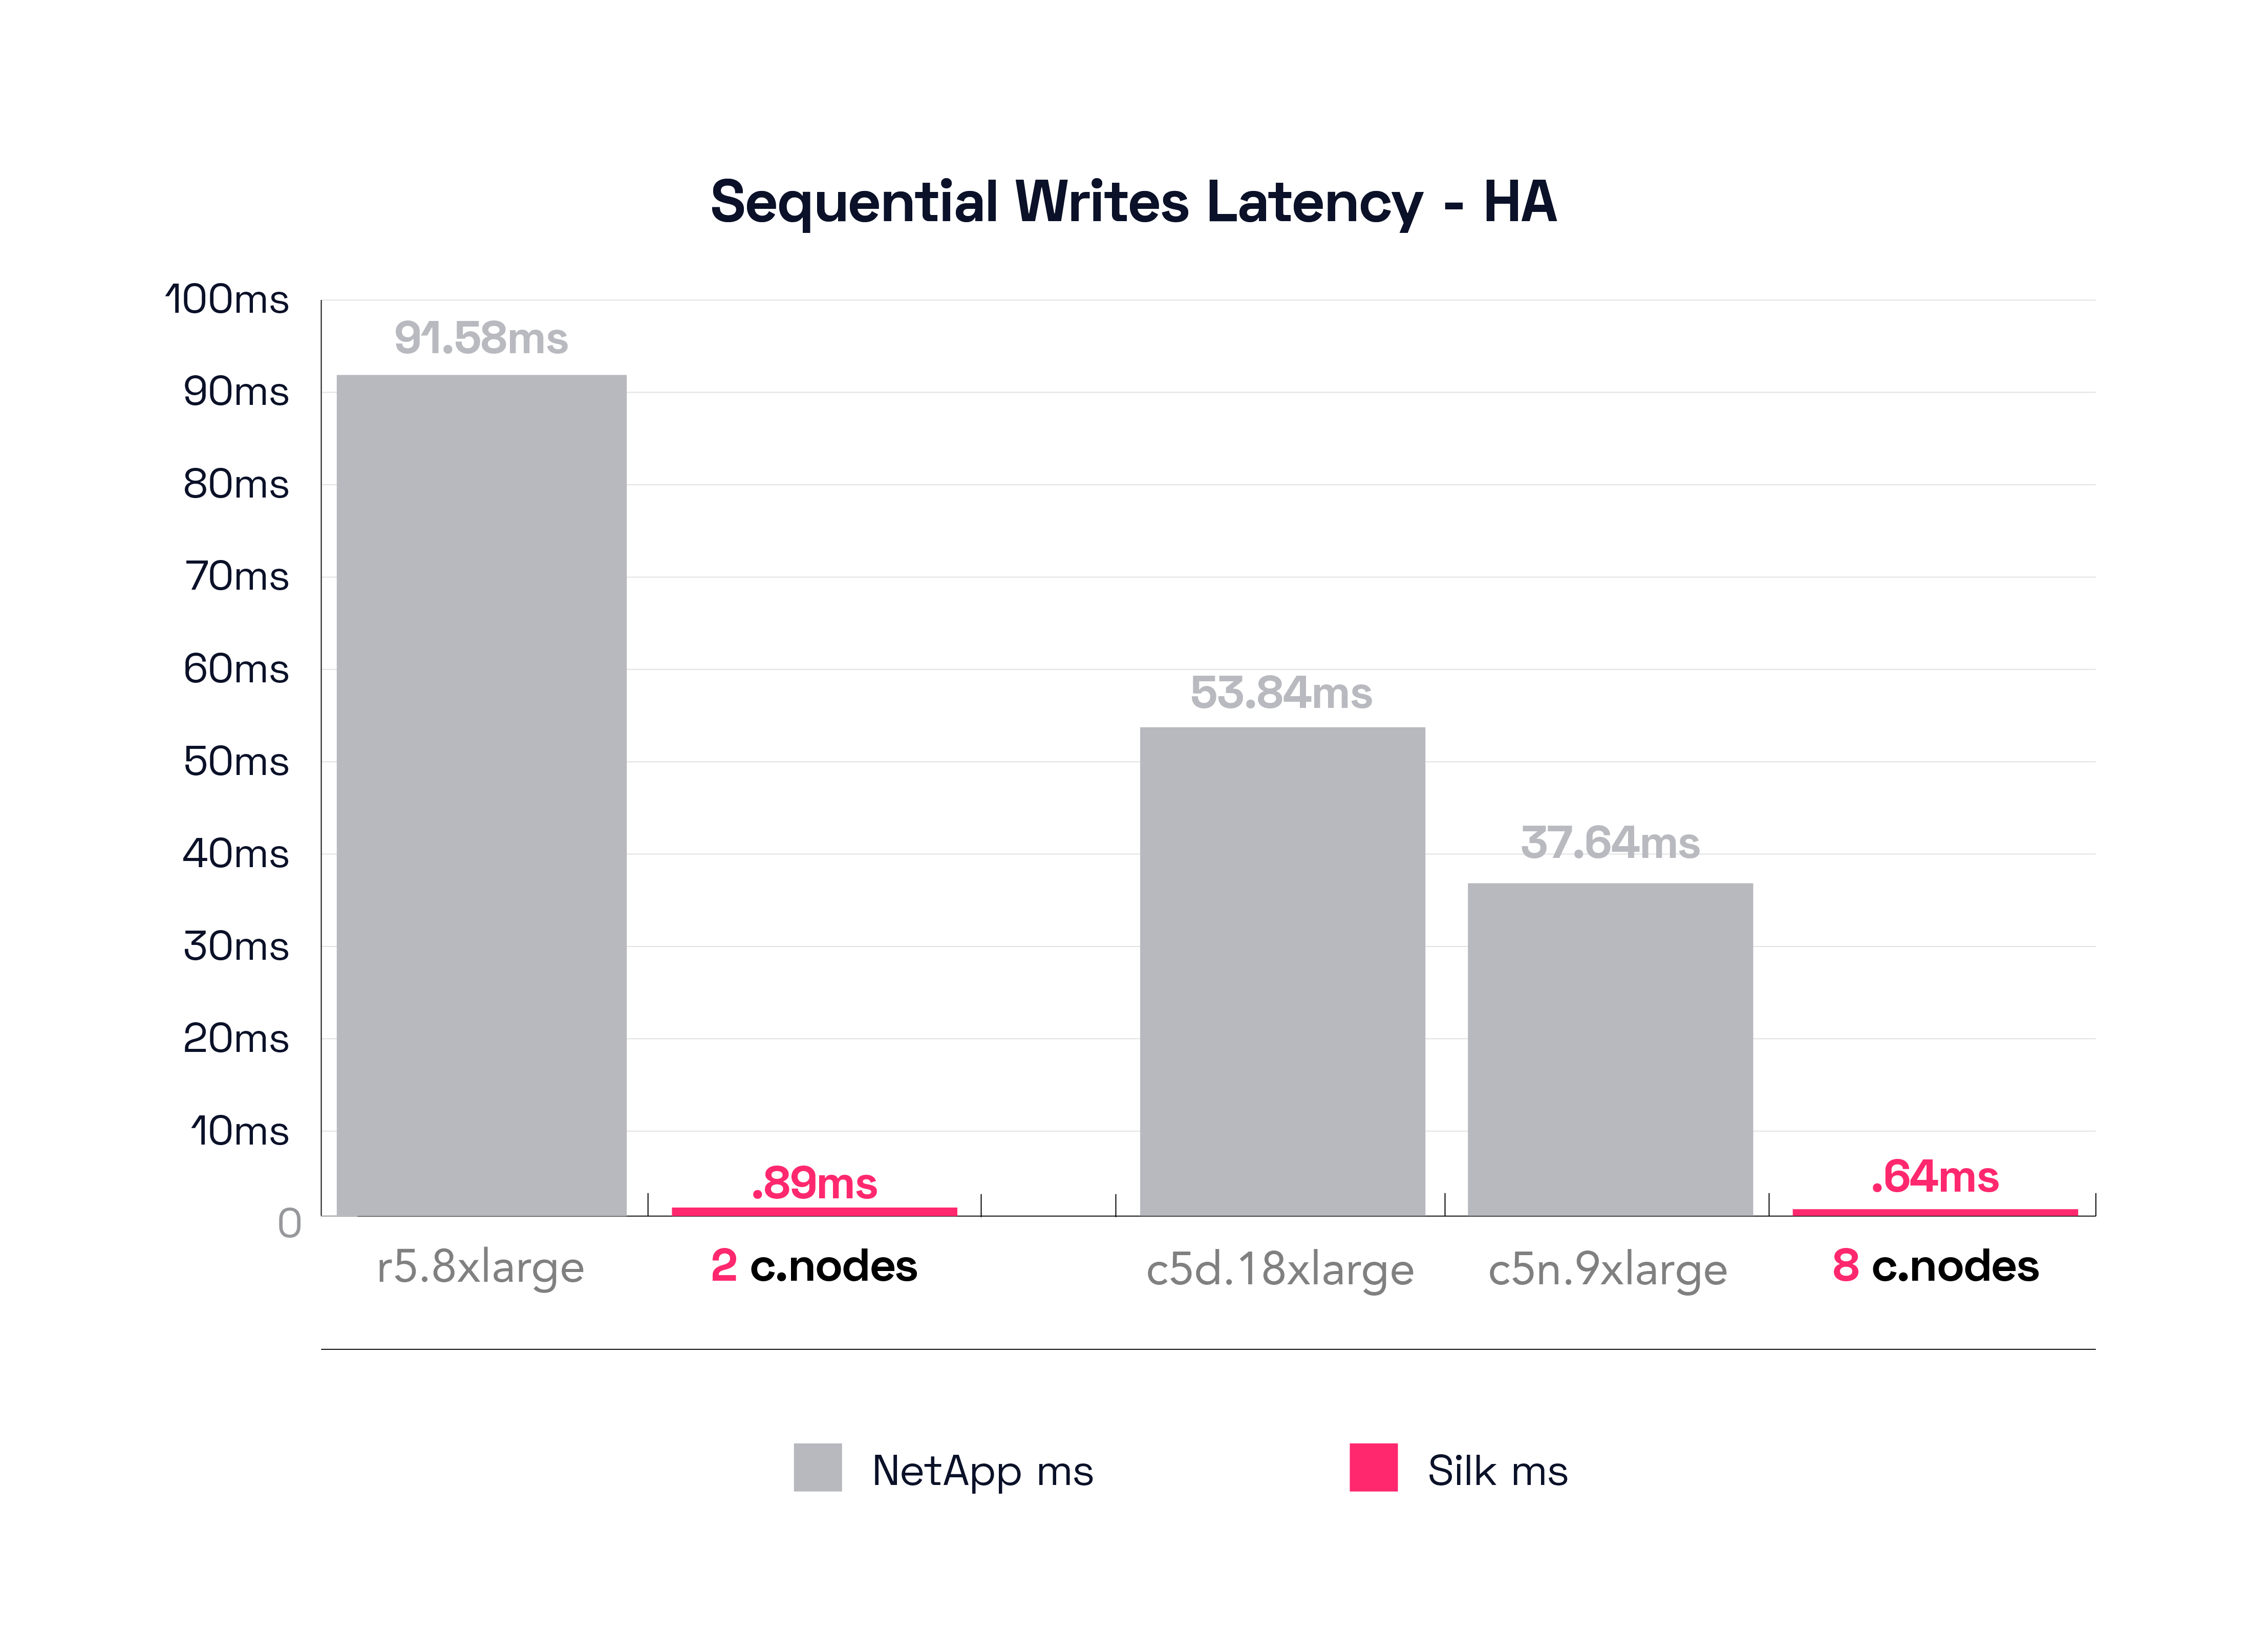
In this test, the r5.8xlarge is the smallest NetApp HA configuration, different from the previous single controller result which was the r5.2xlarge. The r5.8xlarge was able to push 585 MB/s of throughput at a mind boggling 91.58ms of latency. Yes, that’s a ninety-one. *blink* This is supposed to be a faster config, isn’t it? Alas, this shoots right to the heart of the challenge with the NetApp architecture. It can cache reads, but not writes, and while enabling a Sync-Mirror function will speed up read operations, it also tends to double the (already quite substantial) time to commit writes to both sides of the synchronous mirror. It is crushingly difficult for this kind of architecture to handle this type of workload, and it’s not usable for a production environment, in our most humble opinion. BUT—you say, this is a different config from the previous result, this is not a valid comparison! OK, let’s check what the r5.8xlarge result was for the Non-HA config (refer back up to our pinned first graph for that number): history records it as being 676 MB/s running at 40.53ms latency. Math time! It appears that 91MB/s of throughput has been lost (676 down to 585) and we’ve found an additional 51.05ms of latency (40.53 up to 91.58, a 126% increase—more than double) which is shocking! (remember I said you would be shocked, didn’t I)?
As a reminder, Silk’s small 2 c.node config can drive about 1.7 MB/s throughput at 0.89ms latency. Napkin math on this shocking result:
Silk drives 3x more data at 1/100th the latency. Yes, it’s up to 100x faster than the NetApp.
I am shocked, shocked to find such latency results going on in here!
Fine, fine, you say, we wouldn’t run prod on such a small system, let’s see the big config results, stop playing small ball. Fair enough! Let’s check the results from the biggest config.
The best NetApp configuration for this test is the c5n.9xlarge, again different from the previous c5d.18xlarge config. The c5n.9xlarge delivers 897 MB/s of throughput at a painfully deliberative 37.64ms latency. To compare again to the previous c5d.18xlarge, its HA config drives 676 MB/s at 53.84ms latency, versus its first non-HA test result of 990 MB/s throughput at 32ms latency result, which represents simultaneously a massive reduction in throughput and a massive increase in latency from single controller to dual controller—double yikes. You might reliably observe that neither of these results are viable for a real production environment as you would probably experience database / app timeouts randomly (but frequently) anytime you were writing anything, n’est-ce pas? I think so too.
As a reminder, Silk’s 8 c.node config delivered a shining 5.8GB/s of throughput at a positively delicious 0.64ms (640 microseconds) latency. Math: Silk’s 5.8 GB/s of throughput is 555% more than 897 MB/s and 770% more than 676 MB/s. The latency? 37.64ms latency is 5,781% worse than .64ms or, if you prefer the c5d.18xlarge config, 53.84ms latency is 8,313% worse than 640 microseconds. Crikey!
*deep breath* It’s hard to describe the order of magnitude of performance deltas here. Often times, when we speak of comparisons and differences, they are just numbers that don’t matter that much for our real-world applications, but we exaggerate their importance to create differentiation between competing products where really there isn’t much functional difference to speak of. That is 100% not the case here. In the real world, the huge latencies we have observed in these tests would result in enormous IO Wait States that would cause the following unpleasant operational symptoms: extremely slow application response, application timeouts, disconnects, database timeout errors, retransmits (compounding the problem more), all resulting in an overall miserable customer experience.
Besides that, big IO Wait State numbers also means that you are paying a grundle for compute resources that aren’t getting used (I’m waiting, sweetheart, waiting) while you deliver the aforementioned horrible customer satisfaction. Your vendor will then most likely offer up the following helpful and reasonable advice: “You just need to buy more stuff”.
Additional Tests
Well that was quite an adventure—were you adequately shocked? Apologies for the excessive display of math, by way of penance I offer a positive palliative: More tests! But these are not comparative results, so there will be no math! In addition to the Streaming/Sequential write tests, we decided to add in another large block random write test, and a small block write test as well. We find that there’s a huge amount of random writes out there, and if you are leveraging the Silk platform to provide services to many hosts (as you should), the write patterns coming in are effectively random anyways (the old IO Blender effect, for which our patented variable block and LSA technology is a 100% fix). In other words, we handle any size of random writes extremely well! For some reason NetApp chose not to do random write tests. We’re not sure exactly why. . . .perhaps you, our intrepid reader, might offer an opinion on the question?
The two tests we ran were 4K and 64K 100% Random Writes.
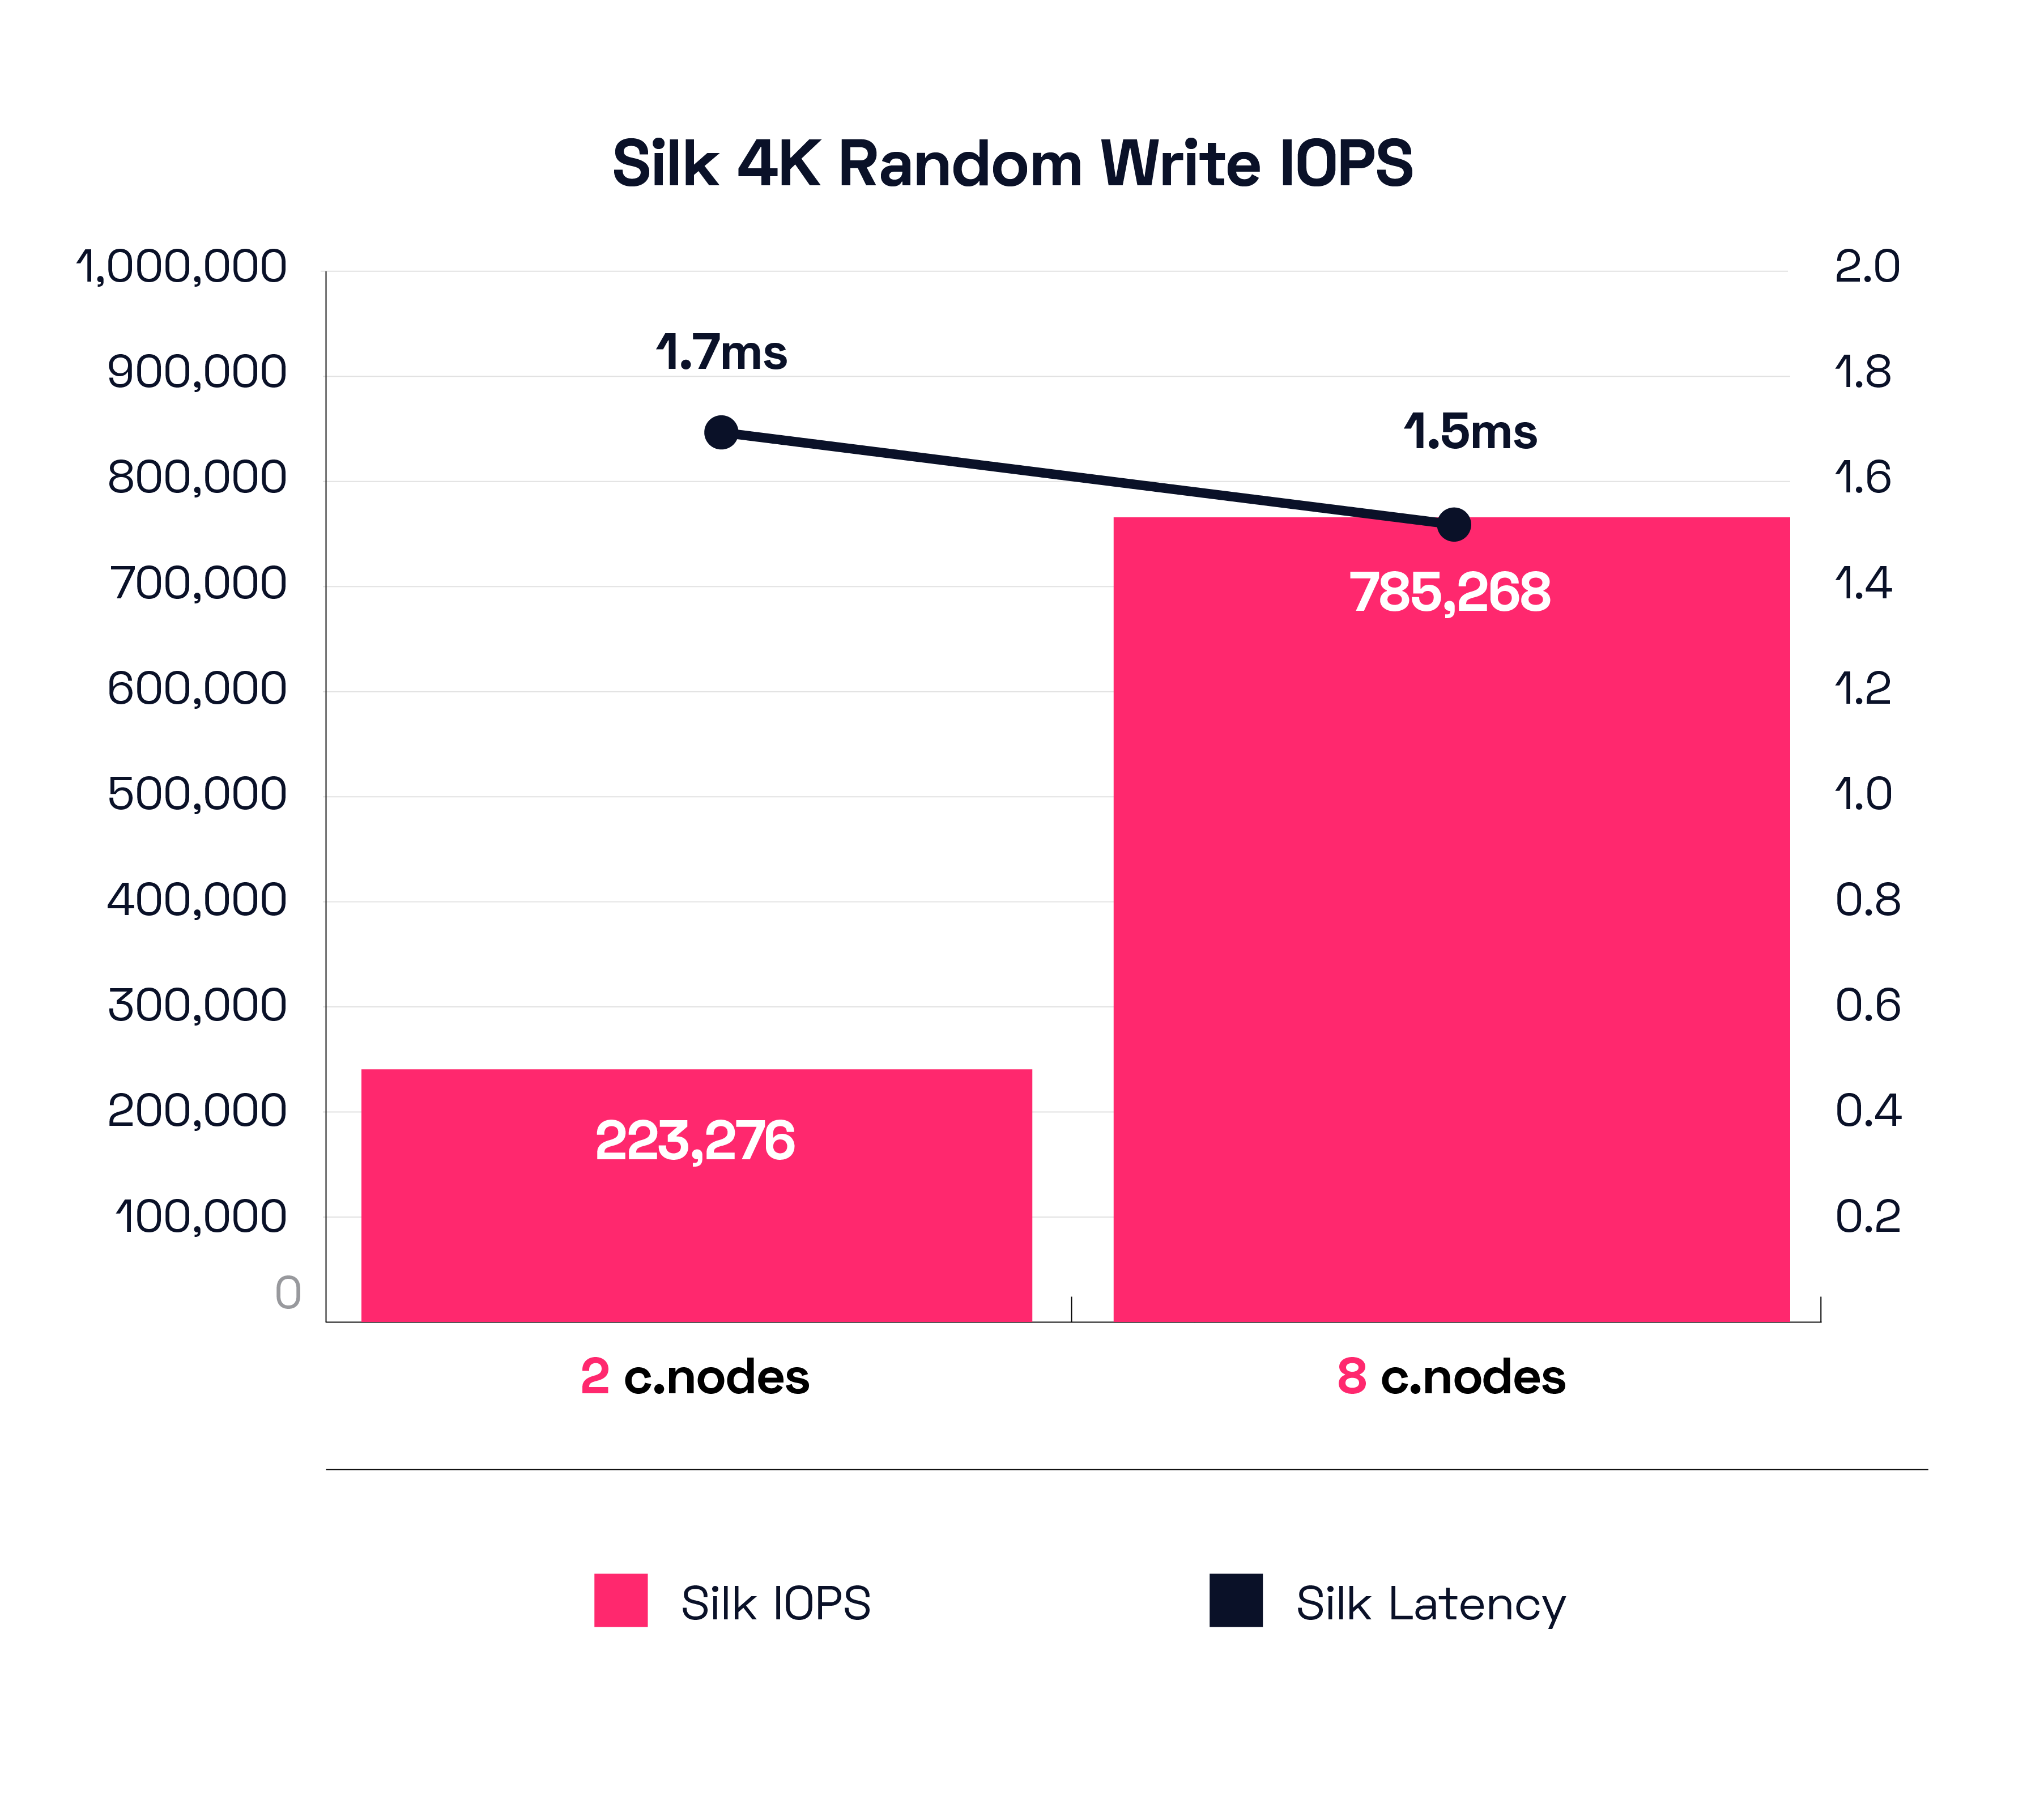
Let’s peruse the small block results first, which means that IOPS and latency are the primary metrics here rather than throughput. With our smallest configuration, 2 c.nodes, we were able to drive 223,276 IOPS at a respectable 1.7ms latency. When we ramp up to our 8 c.node configuration, the Silk platform drives an utterly ludicrous 785,268 IOPS at 1.5ms latency. RELEASE THE HOUNDS!
Yes, Silk has a ludicrous mode switch in it (it’s on by default and can’t be turned off). No additional superfluous expensive sketchy license required either—it’s all inclusive.
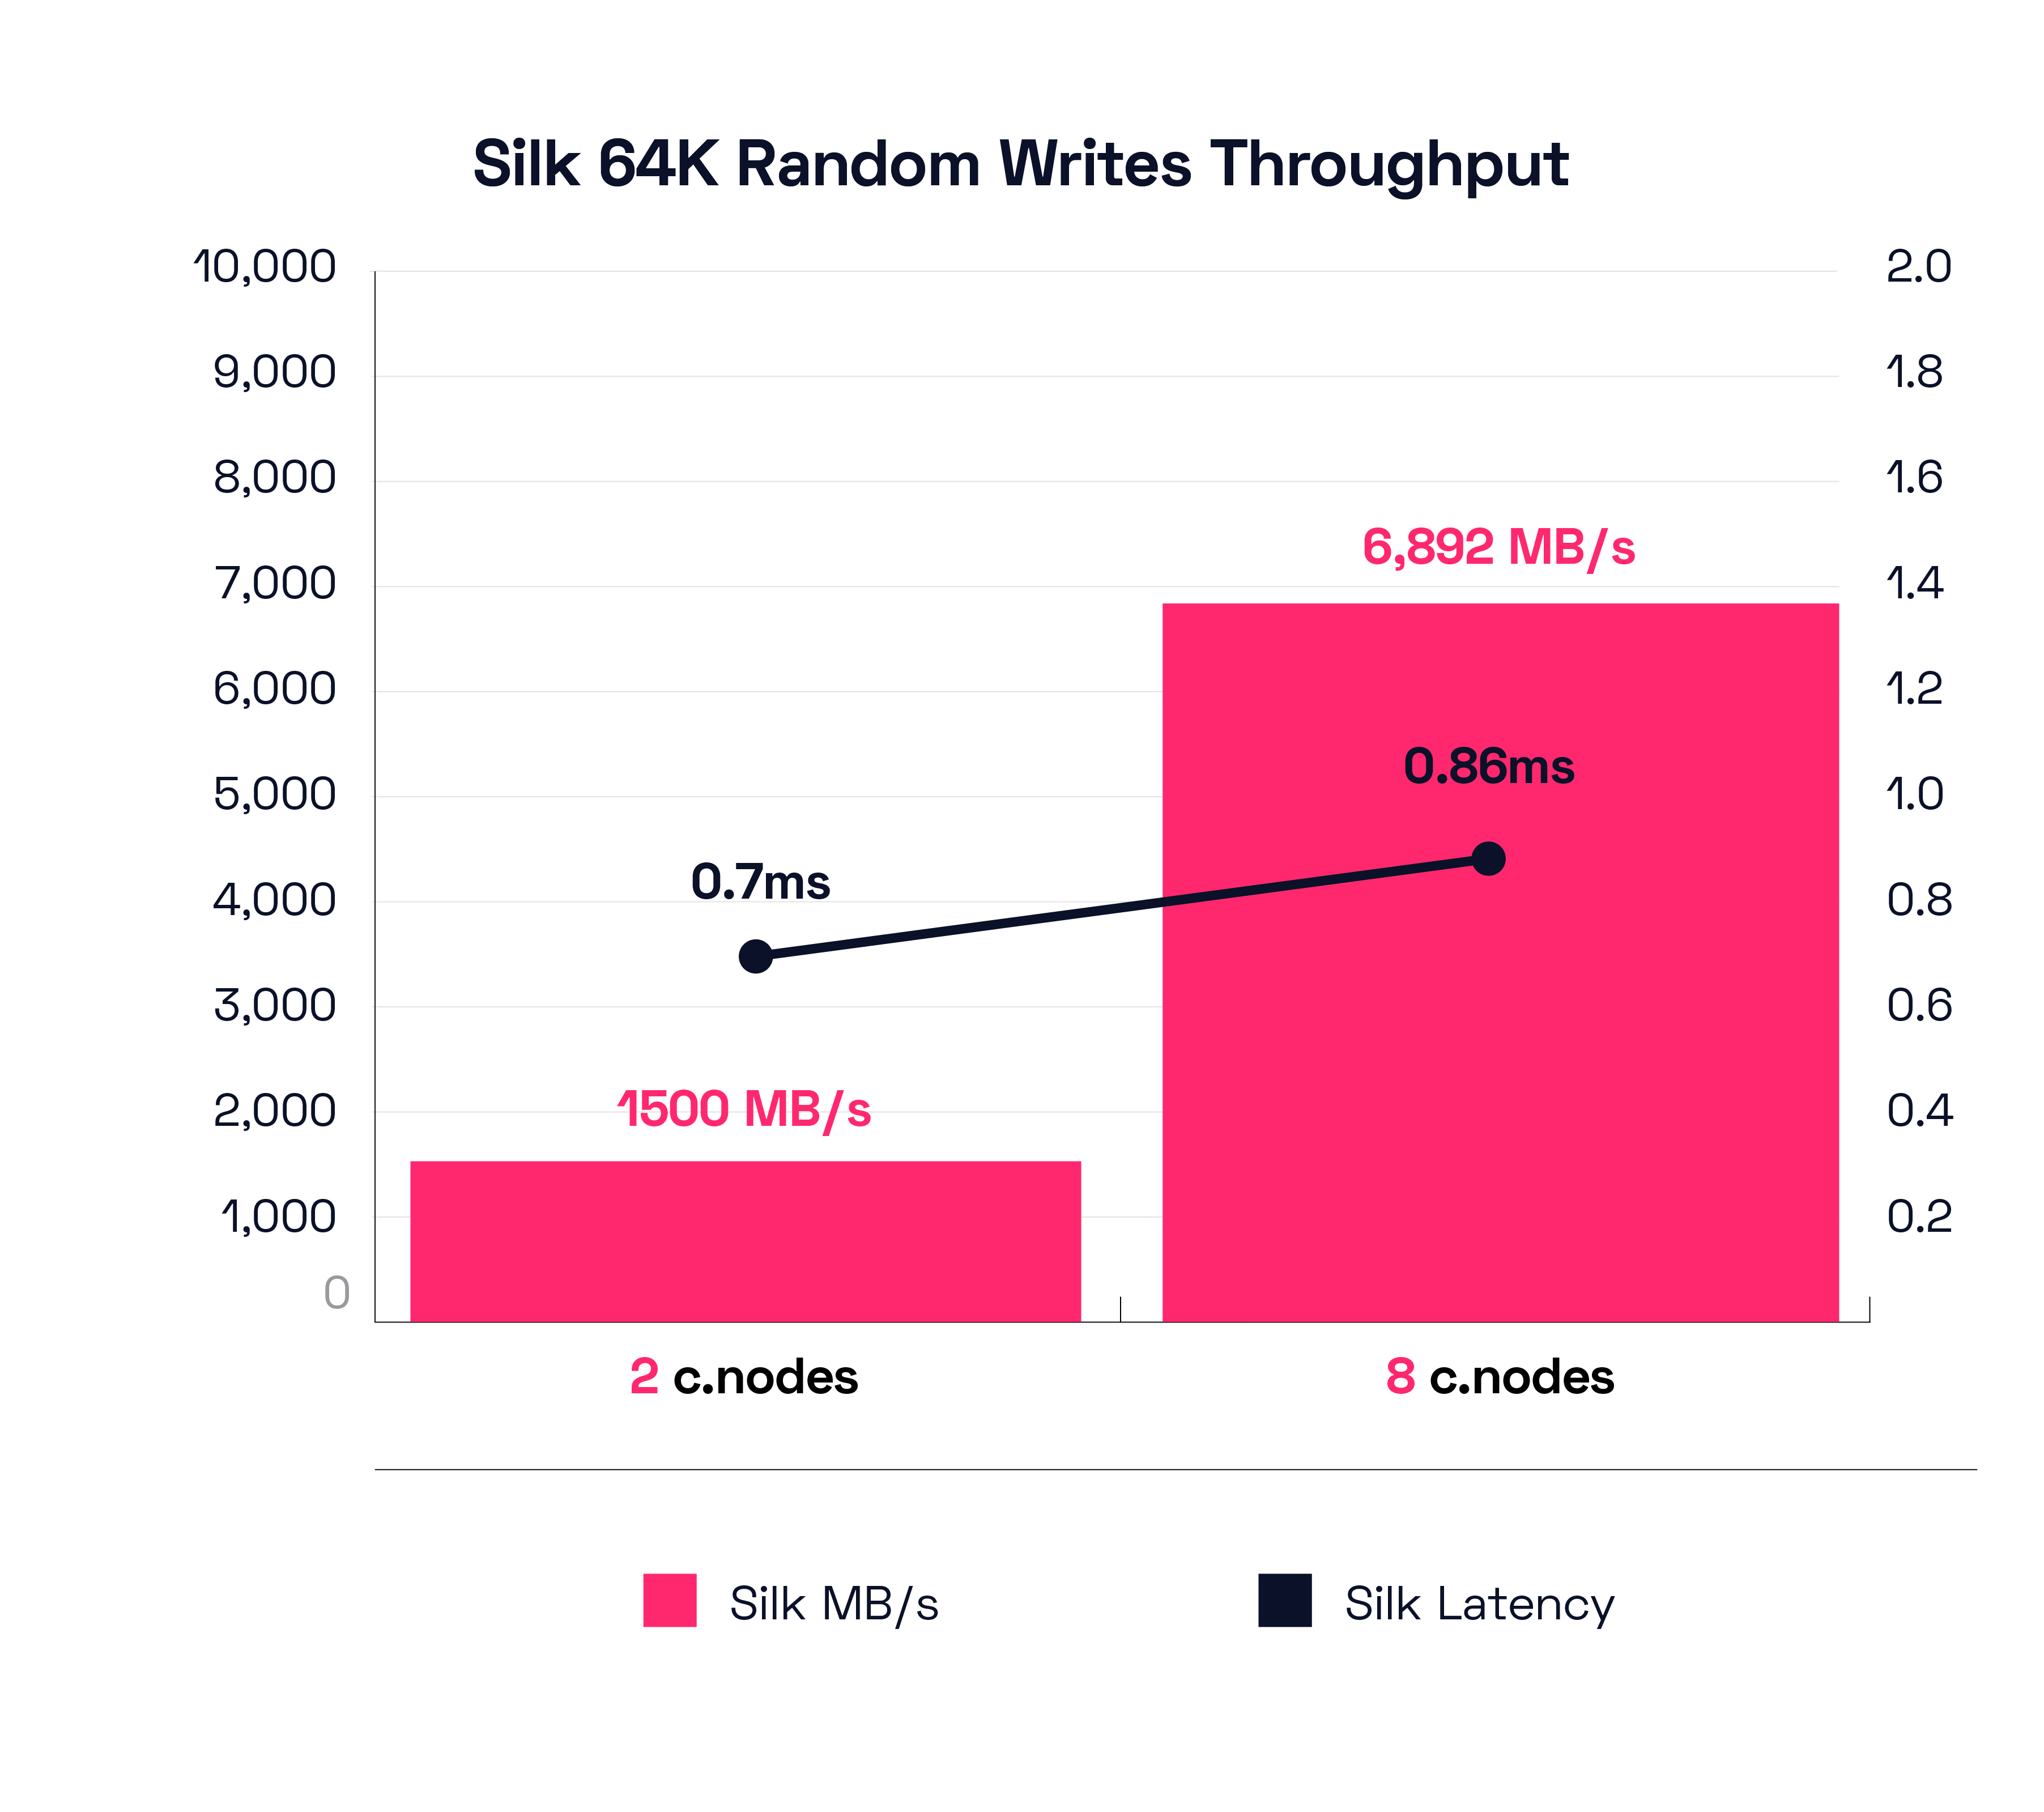
Now let’s peep the large block 64K Random Write test for throughput and latency results. The 2 c.node little scrapper is able to drive 1.5 GB/s of write throughput at a mere .7ms latency. Wait, WHAT? 1.5 GB/s of large block random writes at 700 microseconds latency? Hold the Phone! I must say this is a really strong result. SILK TWO C.NODE ISK STRONK!
And if we need more throughput than that? Our 8 c.node configuration is able to drive 6,892 MB/s throughput at a stellar 0.86 latency. Yes, almost 7GB/s of large block writes at consistent sub-millisecond performance, which is also full ludicrous mode for a fully automated shared services platform with rich data services running. While doing this you can also take and mount dozens of writable instantaneous zero footprint clones in a few seconds—without impacting performance. Silk can support hundreds of hosts and every kind of variably sized workload simultaneously, in a manner far more cost efficient and performant than cloud native. As a final note, remember that the current Silk platform can scale out and in dynamically from 2-3-4-5-6-7-8 nodes on demand, so you can provision the right performance you need and not be stuck paying for too much, or even worse, not have enough.
To summarize today’s learnings: SILK FAST. SILK STRONG.
The Silk platform was built greenfield with patented technology to enable your most demanding mission-critical database workloads and customer-facing applications. Silk can do what no other platform can do—not cloud-native IaaS, not managed DBaaS, not NetApp, nor any other platform—delivering rich data services and autonomous high availability combined with monster IO and huge throughput at consistently dead flat-line low latency that supercharges even the heaviest application and database workloads!
Next up we’ll do our final test comparison vs NetApp with a Mixed Reads/Writes test and summarize all our findings and perhaps explain a bit more why the deltas are so dramatic.
*whispers* it’s because of our architectural differences.
After our glorious conclusion, we will go the extra mile (for you, because we care so deeply) and we’ll show you the results of an extremely intensive real-world Oracle workload with IO numbers. We’ll also put up some TPC-C and SLOB results. After that, we’ll do the same real-world database load tests on Microsoft SQL Server with the IO results and some additional HammerDB NOPM and TPM numbers as well. We might even add in some results of some other popular databases too—see you there!